\n
## Diagram: Instruction Tuning Degradation
### Overview
The image is a diagram illustrating a problem in fine-tuning instruction models. It depicts the degradation of instruction-tuning when models are fine-tuned with unlabeled text from new domains. The diagram uses cartoon llamas to represent the model and icons to represent different domains.
### Components/Axes
The diagram consists of the following elements:
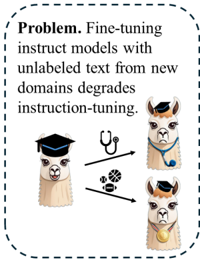
* **Text Block:** At the top, a text block states the problem: "Problem. Fine-tuning instruct models with unlabeled text from new domains degrades instruction-tuning."
* **Llama 1:** A llama wearing a graduation cap, representing the initially instruction-tuned model.
* **Llama 2:** A llama wearing a graduation cap and a stethoscope around its neck, representing the model fine-tuned with medical domain data.
* **Llama 3:** A llama wearing a graduation cap and a gold medal around its neck, representing the model fine-tuned with sports domain data.
* **Arrows:** Two arrows pointing from Llama 1 to Llama 2 and Llama 3, indicating the fine-tuning process.
* **Icons:** A stethoscope icon representing the medical domain and a basketball/soccer ball icon representing the sports domain.
* **Border:** A dashed blue border surrounds the entire diagram.
### Detailed Analysis or Content Details
The diagram visually represents the following:
1. An initial instruction-tuned model (Llama 1) is depicted.
2. This model is then fine-tuned with data from two new domains:
* Medical domain (represented by the stethoscope icon) resulting in Llama 2.
* Sports domain (represented by the basketball/soccer ball icon) resulting in Llama 3.
3. The arrows indicate that the fine-tuning process introduces domain-specific knowledge, but also potentially degrades the original instruction-tuning capabilities.
### Key Observations
The diagram does not contain numerical data or specific values. It is a conceptual illustration of a problem. The key observation is that introducing unlabeled data from new domains can negatively impact the performance of an instruction-tuned model. The use of llamas and icons makes the concept more accessible and memorable.
### Interpretation
The diagram suggests that while fine-tuning can adapt a model to new domains, it can also lead to a loss of general instruction-following ability. This is likely due to the model overfitting to the specific characteristics of the new domain data. The diagram highlights the importance of carefully considering the data used for fine-tuning and potentially employing techniques to mitigate the degradation of instruction-tuning. The diagram is a simplified representation of a complex issue, but it effectively communicates the core problem. It implies that a model that is excellent at following instructions generally may become less so when exposed to new, unlabeled data. The choice of llamas as the model representation is likely intended to be whimsical and engaging, rather than to convey any specific technical meaning.