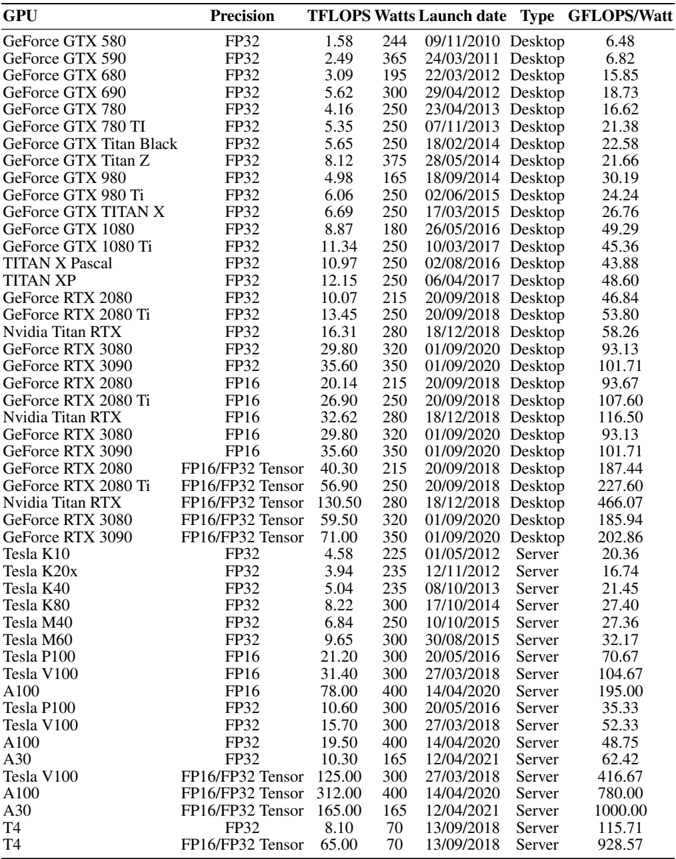
## Data Table: GPU Performance Metrics
### Overview
The image presents a data table comparing the performance of various GPUs (Graphics Processing Units) based on several metrics. The table includes GPU name, precision, TFLOPS (Tera Floating Point Operations Per Second), Watts, launch date, type (Desktop or Server), and GFLOPS/Watt (Giga Floating Point Operations Per Second per Watt).
### Components/Axes
The table has the following columns:
* **GPU:** Name of the GPU (e.g., GeForce GTX 580, Tesla K10, A100).
* **Precision:** Floating-point precision supported by the GPU (e.g., FP32, FP16, FP16/FP32 Tensor).
* **TFLOPS:** Theoretical compute performance in Tera Floating Point Operations Per Second.
* **Watts:** Power consumption of the GPU in Watts.
* **Launch date:** Date when the GPU was launched (MM/DD/YYYY).
* **Type:** Indicates whether the GPU is designed for Desktops or Servers.
* **GFLOPS/Watt:** Performance per Watt, calculated as GFLOPS divided by Watts.
### Detailed Analysis or ### Content Details
Here's a breakdown of the data, including specific values and trends:
* **GeForce GTX Series:**
* The GeForce GTX series includes models from GTX 580 to GTX 1080 Ti.
* TFLOPS ranges from 1.58 (GTX 580) to 11.34 (GTX 1080 Ti).
* Watts range from 165 (GTX 980) to 375 (GTX Titan Z).
* GFLOPS/Watt ranges from 6.48 (GTX 580) to 49.29 (GTX 1080).
* **TITAN Series:**
* Includes TITAN X Pascal and TITAN XP.
* TFLOPS are 10.97 and 12.15, respectively.
* Both consume 250 Watts.
* GFLOPS/Watt are 43.88 and 48.60, respectively.
* **GeForce RTX Series (FP32):**
* Includes RTX 2080, RTX 2080 Ti, RTX 3080, and RTX 3090.
* TFLOPS ranges from 10.07 (RTX 2080) to 35.60 (RTX 3090).
* Watts range from 215 (RTX 2080) to 350 (RTX 3090).
* GFLOPS/Watt ranges from 46.84 (RTX 2080) to 101.71 (RTX 3090).
* **GeForce RTX Series (FP16):**
* Includes RTX 2080, RTX 2080 Ti, RTX 3080, and RTX 3090.
* TFLOPS ranges from 20.14 (RTX 2080) to 35.60 (RTX 3090).
* Watts range from 215 (RTX 2080) to 350 (RTX 3090).
* GFLOPS/Watt ranges from 93.13 (RTX 3080) to 116.50 (Nvidia Titan RTX).
* **GeForce RTX Series (FP16/FP32 Tensor):**
* Includes RTX 2080, RTX 2080 Ti, RTX 3080, and RTX 3090.
* TFLOPS ranges from 40.30 (RTX 2080) to 71.00 (RTX 3090).
* Watts range from 215 (RTX 2080) to 350 (RTX 3090).
* GFLOPS/Watt ranges from 185.94 (RTX 3080) to 466.07 (Nvidia Titan RTX).
* **Nvidia Titan RTX:**
* Available in FP32, FP16, and FP16/FP32 Tensor precisions.
* TFLOPS are 16.31 (FP32), 32.62 (FP16), and 130.50 (FP16/FP32 Tensor).
* Watts are 280 for all precisions.
* GFLOPS/Watt are 58.26 (FP32), 116.50 (FP16), and 466.07 (FP16/FP32 Tensor).
* **Tesla Series:**
* Includes models from K10 to V100.
* TFLOPS ranges from 3.94 (K20x) to 31.40 (V100).
* Watts range from 225 (K10) to 300 (multiple models).
* GFLOPS/Watt ranges from 16.74 (K20x) to 104.67 (V100).
* **A100 Series:**
* Available in FP16, FP32, and FP16/FP32 Tensor precisions.
* TFLOPS are 78.00 (FP16), 19.50 (FP32), and 312.00 (FP16/FP32 Tensor).
* Watts are 400 for all precisions.
* GFLOPS/Watt are 48.75 (FP32), 195.00 (FP16), and 780.00 (FP16/FP32 Tensor).
* **A30 Series:**
* Available in FP32 and FP16/FP32 Tensor precisions.
* TFLOPS are 10.30 (FP32) and 165.00 (FP16/FP32 Tensor).
* Watts are 165 for all precisions.
* GFLOPS/Watt are 62.42 (FP32) and 1000.00 (FP16/FP32 Tensor).
* **T4 Series:**
* Available in FP32 and FP16/FP32 Tensor precisions.
* TFLOPS are 8.10 (FP32) and 65.00 (FP16/FP32 Tensor).
* Watts are 70 for all precisions.
* GFLOPS/Watt are 115.71 (FP32) and 928.57 (FP16/FP32 Tensor).
### Key Observations
* GPUs with FP16/FP32 Tensor precision generally have higher TFLOPS and GFLOPS/Watt compared to FP32 or FP16 alone.
* Server GPUs (Tesla, A100, A30, T4) tend to have higher GFLOPS/Watt than Desktop GPUs (GeForce GTX, RTX, TITAN).
* Newer GPUs generally offer higher TFLOPS and GFLOPS/Watt compared to older models.
* Power consumption (Watts) varies significantly across different GPUs.
### Interpretation
The data demonstrates the evolution of GPU technology, showcasing improvements in performance (TFLOPS) and energy efficiency (GFLOPS/Watt) over time. The shift towards FP16 and Tensor cores indicates a focus on machine learning and AI workloads, where lower precision can be used to accelerate computations. The distinction between Desktop and Server GPUs highlights the different design priorities, with Server GPUs prioritizing performance per watt for data center environments. The table allows for a direct comparison of different GPUs based on key performance metrics, aiding in the selection of the most suitable GPU for a given application.