TECHNICAL ASSET FINGERPRINT
413742a788654dec41407d13
Click to view fullscreen
Press ESC or click to close
FOUND IN PAPERS
EXPERT: healer-alpha-free VERSION 1
RUNTIME: free/openrouter/healer-alpha
INTEL_VERIFIED
## Data Table: NVIDIA GPU Specifications and Performance
### Overview
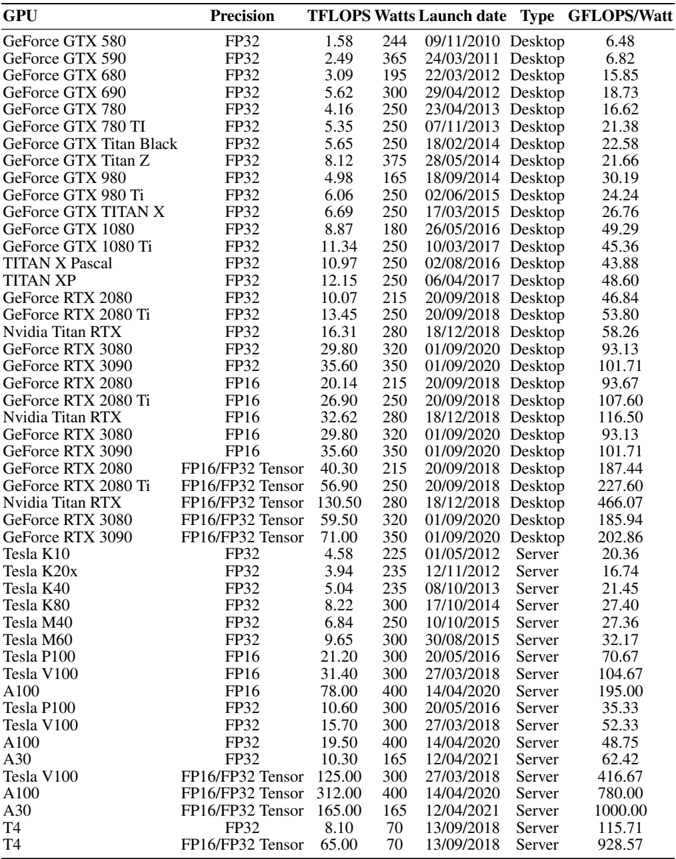
The image displays a comprehensive data table listing specifications and performance metrics for various NVIDIA GPU models. The table includes consumer (GeForce, Titan) and professional/server (Tesla, A-series) GPUs spanning from 2010 to 2021. The data is organized in a grid with 7 columns and 52 rows of GPU entries.
### Components/Axes (Table Columns)
The table has the following columns, from left to right:
1. **GPU**: The model name of the graphics processing unit.
2. **Precision**: The numerical precision format used for the TFLOPS measurement (e.g., FP32, FP16, FP16/FP32 Tensor).
3. **TFLOPS**: Tera Floating-point Operations Per Second, a measure of computational performance.
4. **Watts**: The Thermal Design Power (TDP) or power consumption in watts.
5. **Launch date**: The product launch date in DD/MM/YYYY format.
6. **Type**: The market segment, either "Desktop" (consumer) or "Server" (professional/data center).
7. **GFLOPS/Watt**: A calculated efficiency metric, representing Giga Floating-point Operations Per Second per watt of power consumed.
### Detailed Analysis
The table contains the following data entries, grouped by GPU family for clarity. All values are transcribed directly from the image.
| GPU | Precision | TFLOPS | Watts | Launch Date | Type | GFLOPS/Watt |
| :--- | :--- | :--- | :--- | :--- | :--- | :--- |
| GeForce GTX 580 | FP32 | 1.58 | 244 | 09/11/2010 | Desktop | 6.48 |
| GeForce GTX 590 | FP32 | 2.49 | 365 | 24/03/2011 | Desktop | 6.82 |
| GeForce GTX 680 | FP32 | 3.09 | 195 | 22/03/2012 | Desktop | 15.85 |
| GeForce GTX 690 | FP32 | 5.62 | 300 | 29/04/2012 | Desktop | 18.73 |
| GeForce GTX 780 | FP32 | 4.16 | 250 | 23/04/2013 | Desktop | 16.62 |
| GeForce GTX 780 TI | FP32 | 5.35 | 250 | 07/11/2013 | Desktop | 21.38 |
| GeForce GTX Titan Black | FP32 | 5.65 | 250 | 18/02/2014 | Desktop | 22.58 |
| GeForce GTX Titan Z | FP32 | 8.12 | 375 | 28/05/2014 | Desktop | 21.66 |
| GeForce GTX 980 | FP32 | 4.98 | 165 | 18/09/2014 | Desktop | 30.19 |
| GeForce GTX 980 Ti | FP32 | 6.06 | 250 | 02/06/2015 | Desktop | 24.24 |
| GeForce GTX TITAN X | FP32 | 6.69 | 250 | 17/03/2015 | Desktop | 26.76 |
| GeForce GTX 1080 | FP32 | 8.87 | 180 | 26/05/2016 | Desktop | 49.29 |
| GeForce GTX 1080 Ti | FP32 | 11.34 | 250 | 10/03/2017 | Desktop | 45.36 |
| TITAN X Pascal | FP32 | 10.97 | 250 | 02/08/2016 | Desktop | 43.88 |
| TITAN XP | FP32 | 12.15 | 250 | 06/04/2017 | Desktop | 48.60 |
| GeForce RTX 2080 | FP32 | 10.07 | 215 | 20/09/2018 | Desktop | 46.84 |
| GeForce RTX 2080 Ti | FP32 | 13.45 | 250 | 20/09/2018 | Desktop | 53.80 |
| Nvidia Titan RTX | FP32 | 16.31 | 280 | 18/12/2018 | Desktop | 58.26 |
| GeForce RTX 3080 | FP32 | 29.80 | 320 | 01/09/2020 | Desktop | 93.13 |
| GeForce RTX 3090 | FP32 | 35.60 | 350 | 01/09/2020 | Desktop | 101.71 |
| GeForce RTX 2080 | FP16 | 20.14 | 215 | 20/09/2018 | Desktop | 93.67 |
| GeForce RTX 2080 Ti | FP16 | 26.90 | 250 | 20/09/2018 | Desktop | 107.60 |
| Nvidia Titan RTX | FP16 | 32.62 | 280 | 18/12/2018 | Desktop | 116.50 |
| GeForce RTX 3080 | FP16 | 29.80 | 320 | 01/09/2020 | Desktop | 93.13 |
| GeForce RTX 3090 | FP16 | 35.60 | 350 | 01/09/2020 | Desktop | 101.71 |
| GeForce RTX 2080 | FP16/FP32 Tensor | 40.30 | 215 | 20/09/2018 | Desktop | 187.44 |
| GeForce RTX 2080 Ti | FP16/FP32 Tensor | 56.90 | 250 | 20/09/2018 | Desktop | 227.60 |
| Nvidia Titan RTX | FP16/FP32 Tensor | 130.50 | 280 | 18/12/2018 | Desktop | 466.07 |
| GeForce RTX 3080 | FP16/FP32 Tensor | 59.50 | 320 | 01/09/2020 | Desktop | 185.94 |
| GeForce RTX 3090 | FP16/FP32 Tensor | 71.00 | 350 | 01/09/2020 | Desktop | 202.86 |
| Tesla K10 | FP32 | 4.58 | 225 | 01/05/2012 | Server | 20.36 |
| Tesla K20x | FP32 | 3.94 | 235 | 12/11/2011 | Server | 16.74 |
| Tesla K40 | FP32 | 5.04 | 235 | 08/10/2013 | Server | 21.45 |
| Tesla K80 | FP32 | 8.22 | 300 | 17/10/2014 | Server | 27.40 |
| Tesla M40 | FP32 | 6.84 | 250 | 10/10/2015 | Server | 27.36 |
| Tesla M60 | FP32 | 9.65 | 300 | 30/08/2015 | Server | 32.17 |
| Tesla P100 | FP32 | 10.60 | 300 | 20/05/2016 | Server | 35.33 |
| Tesla V100 | FP32 | 15.70 | 300 | 27/03/2018 | Server | 52.33 |
| A100 | FP32 | 19.50 | 400 | 14/04/2020 | Server | 48.75 |
| A30 | FP32 | 10.30 | 165 | 12/04/2021 | Server | 62.42 |
| Tesla P100 | FP16 | 21.20 | 300 | 20/05/2016 | Server | 70.67 |
| Tesla V100 | FP16 | 31.40 | 300 | 27/03/2018 | Server | 104.67 |
| A100 | FP16 | 78.00 | 400 | 14/04/2020 | Server | 195.00 |
| Tesla V100 | FP16/FP32 Tensor | 125.00 | 300 | 27/03/2018 | Server | 416.67 |
| A100 | FP16/FP32 Tensor | 312.00 | 400 | 14/04/2020 | Server | 780.00 |
| A30 | FP16/FP32 Tensor | 165.00 | 165 | 12/04/2021 | Server | 1000.00 |
| T4 | FP32 | 8.10 | 70 | 13/09/2018 | Server | 115.71 |
| T4 | FP16/FP32 Tensor | 65.00 | 70 | 13/09/2018 | Server | 928.57 |
### Key Observations
1. **Performance Trend:** Raw TFLOPS (FP32) has increased dramatically over time, from 1.58 (GTX 580, 2010) to 35.60 (RTX 3090, 2020) for desktop cards, and up to 312.00 (A100 Tensor) for server cards.
2. **Efficiency Trend:** The GFLOPS/Watt metric shows a strong upward trend, indicating significant improvements in performance per watt. The most efficient card listed is the A30 (Server) at 1000.00 GFLOPS/Watt using Tensor cores.
3. **Tensor Core Impact:** For GPUs that support it, the "FP16/FP32 Tensor" precision yields vastly higher TFLOPS and efficiency numbers compared to standard FP32 or FP16, highlighting the specialized hardware's advantage for AI workloads.
4. **Power Consumption:** High-performance GPUs consistently have high TDPs, often 250W-350W for top-tier desktop models and 300W-400W for server models. The T4 is a notable low-power exception at 70W.
5. **Product Segmentation:** The table clearly separates consumer "Desktop" cards from "Server" cards, with the latter often featuring higher absolute performance and efficiency metrics tailored for data centers.
### Interpretation
This table serves as a historical record of NVIDIA's GPU evolution, demonstrating two key engineering trajectories: the relentless pursuit of higher raw computational power (TFLOPS) and the critical importance of improving energy efficiency (GFLOPS/Watt). The data suggests that architectural innovations, particularly the introduction of Tensor cores for AI acceleration, have been the primary driver of efficiency gains in recent years, far outpacing gains from traditional FP32 scaling alone.
The stark difference between the best consumer card (RTX 3090 at 202.86 GFLOPS/Watt Tensor) and the best server card (A30 at 1000.00 GFLOPS/Watt Tensor) underscores the different design priorities: desktop GPUs balance performance, power, and cost for gaming and prosumer use, while data center GPUs like the A30 and A100 are optimized for maximum throughput and efficiency within strict power envelopes for large-scale AI training and inference. The table is a valuable resource for comparing generational leaps and understanding the performance/watt trade-offs in GPU selection for different workloads.
DECODING INTELLIGENCE...