## Table: GPU Performance Metrics
### Overview
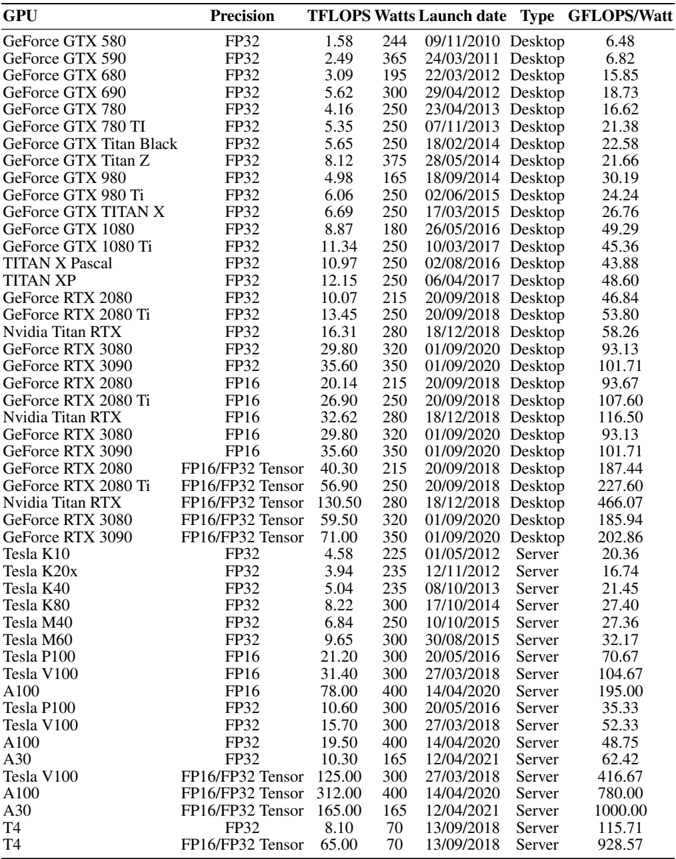
The table presents a comprehensive dataset of GPU models, detailing their technical specifications, performance metrics, and launch information. It includes consumer-grade GeForce GPUs, professional-grade Tesla GPUs, and server-focused models, with metrics like TFLOPS, power consumption (Watts), launch dates, and efficiency (GFLOPS/Watt).
### Components/Axes
- **Columns**:
- **GPU**: Model name (e.g., GeForce GTX 580, Tesla A100).
- **Precision**: Compute architecture (FP32, FP16, FP32 Tensor).
- **TFLOPS**: Theoretical peak performance in teraflops.
- **Watts**: Power consumption in watts.
- **Launch date**: Release date in MM/DD/YYYY format.
- **Type**: Categorization as "Desktop" or "Server".
- **GFLOPS/Watt**: Efficiency metric (performance per watt).
### Detailed Analysis
1. **GeForce GTX Series (Desktop)**:
- Early models (GTX 580–GTX 980 Ti) show gradual improvements in TFLOPS (1.58–6.69) and GFLOPS/Watt (6.48–24.24).
- Later models (RTX 2080 Ti, RTX 3090) use FP16/Tensor precision, achieving TFLOPS up to 56.90 and GFLOPS/Watt up to 227.60.
- Power consumption ranges from 244W (GTX 580) to 350W (RTX 3090).
2. **Tesla Series (Server/Desktop)**:
- Server GPUs (Tesla K10–A30) prioritize high TFLOPS (4.58–165.00) and efficiency (20.36–1000.00 GFLOPS/Watt).
- A100 (FP16) achieves 19.50 TFLOPS at 400W (48.75 GFLOPS/Watt), while A30 (FP32 Tensor) reaches 10.30 TFLOPS at 165W (62.42 GFLOPS/Watt).
- Tesla V100 (FP16/Tensor) dominates with 125.00 TFLOPS at 300W (416.67 GFLOPS/Watt).
3. **Precision Impact**:
- FP32 models (e.g., GTX 1080 Ti) average ~10 TFLOPS, while FP16/Tensor models (e.g., RTX 3090 Ti) exceed 50 TFLOPS.
- Tensor cores (e.g., RTX 3090 Ti) enable higher efficiency despite similar power consumption.
### Key Observations
- **Performance Scaling**: Newer GPUs (e.g., RTX 3090 Ti, A100) show exponential gains in TFLOPS and efficiency compared to older models (e.g., GTX 580).
- **Server Dominance**: Tesla GPUs (e.g., A100, A30) outperform consumer GPUs in both raw performance and efficiency, reflecting their optimization for computational workloads.
- **Power Efficiency**: High-end models like the RTX 3090 Ti (227.60 GFLOPS/Watt) and Tesla A100 (48.75 GFLOPS/Watt) balance power draw with performance.
- **Precision Trade-offs**: FP16/Tensor models achieve higher TFLOPS but may sacrifice single-precision accuracy, critical for specific workloads.
### Interpretation
The data highlights the evolution of GPU architecture toward higher performance and efficiency, driven by advancements in precision (FP16/Tensor) and parallel processing. Server GPUs (Tesla) prioritize sustained computational power for AI/ML and HPC tasks, while consumer GPUs (GeForce) focus on gaming and general computing. The RTX 3090 Ti and Tesla A100 represent benchmarks in consumer and server segments, respectively, with the latter excelling in data-center efficiency. The table underscores the importance of precision and architecture design in meeting diverse computational demands.