## Log-Log Chart: LM Loss vs. PFLOP/s-days
### Overview
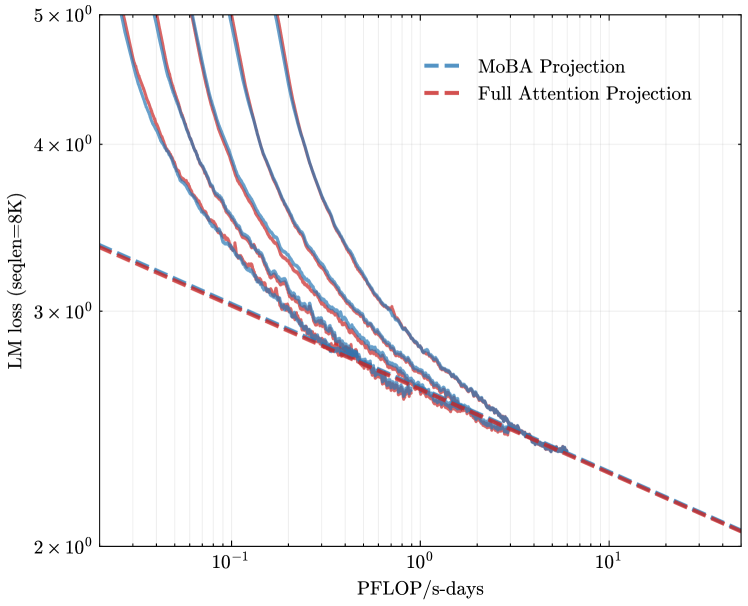
The image is a log-log chart comparing the language modeling (LM) loss of MoBA Projection and Full Attention Projection models against the computational cost measured in PFLOP/s-days. The chart displays multiple lines for MoBA Projection, likely representing different configurations or runs.
### Components/Axes
* **Title:** Implicit, but the chart compares LM loss vs. computational cost.
* **X-axis:** PFLOP/s-days (PetaFLOPS per second-days). Logarithmic scale. Axis markers are at 10<sup>-1</sup>, 10<sup>0</sup> (1), and 10<sup>1</sup> (10).
* **Y-axis:** LM loss (seqlen=8K). Logarithmic scale. Axis markers are at 2 x 10<sup>0</sup> (2), 3 x 10<sup>0</sup> (3), 4 x 10<sup>0</sup> (4), and 5 x 10<sup>0</sup> (5).
* **Legend:** Located at the top-center of the chart.
* MoBA Projection: Blue dashed line.
* Full Attention Projection: Red dashed line.
### Detailed Analysis
* **MoBA Projection:** There are multiple blue lines, all solid. Each line represents a different run or configuration of the MoBA Projection model. All lines show a downward trend, indicating decreasing LM loss with increasing computational cost.
* The leftmost MoBA Projection line starts at approximately (0.04, 5) and decreases to approximately (2, 2.3).
* The rightmost MoBA Projection line starts at approximately (0.2, 5) and decreases to approximately (2, 2.3).
* **Full Attention Projection:** Represented by a single red dashed line. This line also shows a downward trend.
* The Full Attention Projection line starts at approximately (0.04, 3.5) and decreases to approximately (20, 2.1).
### Key Observations
* The MoBA Projection models (multiple runs) generally exhibit higher initial LM loss compared to the Full Attention Projection model at lower computational costs.
* As the computational cost increases, the LM loss for all MoBA Projection models decreases and converges towards a similar level as the Full Attention Projection model.
* The Full Attention Projection model shows a more consistent and gradual decrease in LM loss across the range of computational costs.
### Interpretation
The chart suggests that while MoBA Projection models may initially perform worse than Full Attention Projection models in terms of LM loss, they can achieve comparable performance with sufficient computational resources. The multiple lines for MoBA Projection could indicate variability in training or sensitivity to hyperparameter settings. The Full Attention Projection model appears to be more stable and efficient in reducing LM loss with increasing computational cost, at least within the observed range. The logarithmic scales highlight the diminishing returns of increased computation on LM loss.