\n
## Chart: LM Loss vs. PFLOP/s-days
### Overview
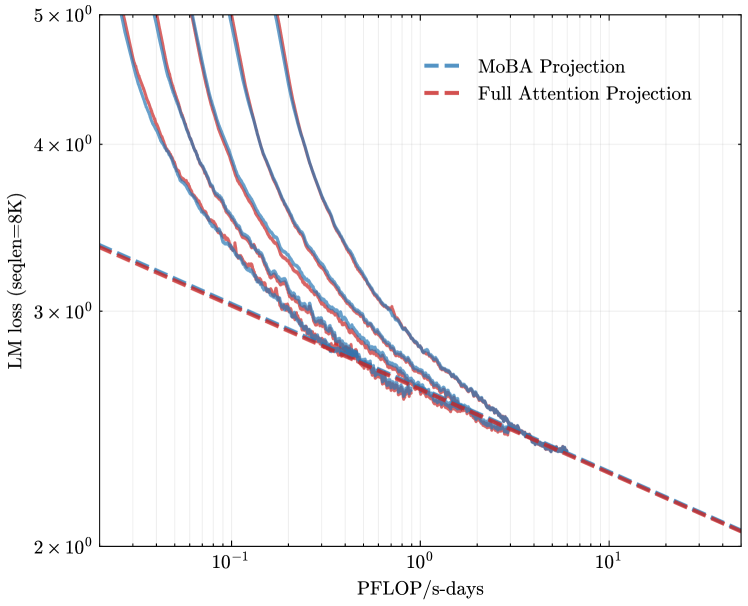
The image presents a line chart comparing the Language Model (LM) loss for two projection methods – MoBA Projection and Full Attention Projection – as a function of PFLOP/s-days (floating point operations per second per day). The chart displays the loss decreasing as computational effort increases, indicating improved model performance. Multiple lines are present for each projection method, likely representing different runs or variations.
### Components/Axes
* **X-axis:** PFLOP/s-days, ranging from approximately 0.01 to 10, displayed on a logarithmic scale.
* **Y-axis:** LM Loss (seqlen=8K), ranging from approximately 2 x 10<sup>2</sup> to 5 x 10<sup>3</sup>, displayed on a logarithmic scale. The "(seqlen=8K)" indicates the loss is calculated for a sequence length of 8000.
* **Legend:** Located in the top-right corner.
* MoBA Projection: Represented by a solid blue line. Multiple lines are present.
* Full Attention Projection: Represented by a dashed red line. Multiple lines are present.
* **Grid:** A light gray grid is overlaid on the chart to aid in reading values.
### Detailed Analysis
**MoBA Projection (Blue Lines):**
There are approximately 6 blue lines representing MoBA Projection. The lines generally trend downwards, indicating decreasing loss with increasing PFLOP/s-days.
* Line 1 (Top-most): Starts at approximately 4.8 x 10<sup>3</sup> at 0.01 PFLOP/s-days and decreases to approximately 2.5 x 10<sup>2</sup> at 10 PFLOP/s-days.
* Line 2: Starts at approximately 4.5 x 10<sup>3</sup> at 0.01 PFLOP/s-days and decreases to approximately 2.4 x 10<sup>2</sup> at 10 PFLOP/s-days.
* Line 3: Starts at approximately 4.2 x 10<sup>3</sup> at 0.01 PFLOP/s-days and decreases to approximately 2.3 x 10<sup>2</sup> at 10 PFLOP/s-days.
* Line 4: Starts at approximately 3.9 x 10<sup>3</sup> at 0.01 PFLOP/s-days and decreases to approximately 2.2 x 10<sup>2</sup> at 10 PFLOP/s-days.
* Line 5: Starts at approximately 3.6 x 10<sup>3</sup> at 0.01 PFLOP/s-days and decreases to approximately 2.1 x 10<sup>2</sup> at 10 PFLOP/s-days.
* Line 6 (Bottom-most): Starts at approximately 3.3 x 10<sup>3</sup> at 0.01 PFLOP/s-days and decreases to approximately 2.0 x 10<sup>2</sup> at 10 PFLOP/s-days.
**Full Attention Projection (Red Lines):**
There are approximately 6 red dashed lines representing Full Attention Projection. These lines also trend downwards, but generally start at higher loss values and decrease more slowly than the MoBA Projection lines.
* Line 1 (Top-most): Starts at approximately 4.9 x 10<sup>3</sup> at 0.01 PFLOP/s-days and decreases to approximately 3.0 x 10<sup>2</sup> at 10 PFLOP/s-days.
* Line 2: Starts at approximately 4.6 x 10<sup>3</sup> at 0.01 PFLOP/s-days and decreases to approximately 2.9 x 10<sup>2</sup> at 10 PFLOP/s-days.
* Line 3: Starts at approximately 4.3 x 10<sup>3</sup> at 0.01 PFLOP/s-days and decreases to approximately 2.8 x 10<sup>2</sup> at 10 PFLOP/s-days.
* Line 4: Starts at approximately 4.0 x 10<sup>3</sup> at 0.01 PFLOP/s-days and decreases to approximately 2.7 x 10<sup>2</sup> at 10 PFLOP/s-days.
* Line 5: Starts at approximately 3.7 x 10<sup>3</sup> at 0.01 PFLOP/s-days and decreases to approximately 2.6 x 10<sup>2</sup> at 10 PFLOP/s-days.
* Line 6 (Bottom-most): Starts at approximately 3.4 x 10<sup>3</sup> at 0.01 PFLOP/s-days and decreases to approximately 2.5 x 10<sup>2</sup> at 10 PFLOP/s-days.
### Key Observations
* MoBA Projection consistently achieves lower LM loss values than Full Attention Projection across the entire range of PFLOP/s-days.
* The multiple lines for each projection method suggest variability in the results, potentially due to different initialization, training data, or hyperparameters.
* The rate of loss reduction diminishes as PFLOP/s-days increases for both methods, indicating diminishing returns from increased computation.
* The logarithmic scales on both axes compress the data, making it easier to visualize the trends.
### Interpretation
The chart demonstrates that MoBA Projection is more efficient than Full Attention Projection in reducing LM loss for a given amount of computational effort (PFLOP/s-days). This suggests that MoBA Projection is a more effective method for training language models, particularly when computational resources are limited. The spread of lines for each method indicates that the performance is not deterministic and can vary. The diminishing returns observed at higher PFLOP/s-days suggest that there is a point beyond which further increasing computation yields only marginal improvements in model performance. The sequence length of 8K is a key parameter, and the results may differ for other sequence lengths. The chart provides valuable insights into the trade-off between computational cost and model accuracy, guiding the selection of appropriate projection methods for language model training.