## Diagram: Feynman Diagram Transformation
### Overview
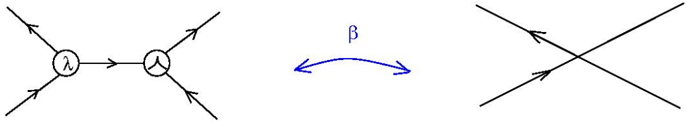
The image depicts a transformation between two Feynman diagrams, connected by a blue, double-headed arrow labeled with the Greek letter beta (β). The diagram on the left shows two vertices connected by an internal line, each vertex having two external lines. The diagram on the right shows two crossing lines.
### Components/Axes
* **Left Diagram:**
* Two vertices, each represented by a circle.
* The left vertex is labeled with "λ" (lambda).
* The right vertex is labeled with "Λ" (Lambda).
* Each vertex has two incoming/outgoing lines.
* The vertices are connected by a single internal line with an arrow indicating direction.
* **Transformation Arrow:**
* A blue, double-headed curved arrow connects the two diagrams.
* The arrow is labeled with "β" (beta) above it.
* **Right Diagram:**
* Two lines crossing each other.
* Each line has an arrow indicating direction.
### Detailed Analysis
* **Left Diagram:** The left vertex has two incoming lines and one outgoing line. The right vertex has one incoming line and two outgoing lines. The internal line connects the two vertices, with the arrow pointing from the left vertex (λ) to the right vertex (Λ).
* **Transformation Arrow:** The blue arrow indicates a transformation or relationship between the two diagrams. The "β" likely represents a parameter or process associated with this transformation.
* **Right Diagram:** The two lines cross each other. One line has an arrow pointing from the bottom-left to the top-right. The other line has an arrow pointing from the top-left to the bottom-right.
### Key Observations
* The diagram shows a transformation between a vertex-based interaction (left) and a direct interaction (right).
* The "β" parameter likely governs the strength or probability of this transformation.
* The arrows on the lines indicate the direction of particle flow.
### Interpretation
The image represents a relationship between two different ways of representing a physical process in quantum field theory. The left diagram shows an interaction mediated by vertices and internal lines, while the right diagram shows a direct interaction. The transformation between these two representations is governed by the parameter "β". This could represent a change of basis or a different way of calculating the same physical quantity. The specific meaning of "λ", "Λ", and "β" would depend on the context of the physical system being described.