\n
## Diagram: Feynman Diagram Representation
### Overview
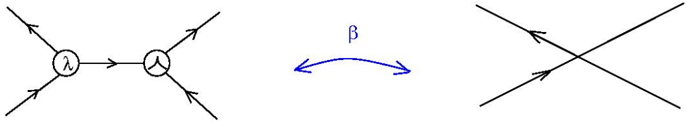
The image depicts a Feynman diagram, a pictorial representation of particle interactions in quantum field theory. It shows a process involving a particle emitting and then absorbing a photon, represented by the wavy line. A second diagram shows two particles crossing. The diagrams are separated by a symbol representing beta.
### Components/Axes
The diagram consists of the following components:
* **Lines:** Straight lines represent fermions (matter particles). Arrows on the lines indicate the direction of particle propagation (time flow).
* **Wavy Line:** A wavy line represents a photon (force carrier).
* **Vertices:** Circles represent interaction vertices where particles interact.
* **β:** A symbol, likely representing a parameter or angle, with a blue, curved, double-headed arrow.
### Detailed Analysis or Content Details
The first diagram shows:
* A single fermion line entering a vertex.
* From this vertex, a wavy line (photon) emerges.
* The photon then enters another vertex.
* From the second vertex, multiple fermion lines exit.
* The first vertex has a symbol resembling a sine wave (λ) inside the circle.
The second diagram shows:
* Two straight lines crossing each other.
* Each line has an arrow indicating the direction of particle flow.
* The lines intersect at an angle.
The symbol β is positioned between the two diagrams. It consists of a curved, double-headed arrow in blue.
### Key Observations
* The first diagram represents a process where a particle emits a photon and then interacts with other particles.
* The second diagram represents a scattering process where two particles exchange momentum.
* The symbol β likely represents a physical quantity related to the interaction, such as a scattering angle or a coupling constant.
* The diagrams are simplified representations of complex quantum processes.
### Interpretation
The image illustrates fundamental concepts in quantum field theory. The Feynman diagrams provide a visual way to understand particle interactions. The first diagram shows a basic electromagnetic interaction, where a charged particle emits and absorbs a photon. The second diagram shows a scattering event, where two particles interact and change their trajectories. The symbol β suggests that the diagrams are related to a specific physical process or calculation. The diagrams are not providing numerical data, but rather a qualitative representation of particle behavior. The diagrams are a visual language for physicists to describe and calculate the probabilities of different particle interactions. The use of arrows indicates the direction of time and particle flow, which is crucial for understanding the dynamics of these interactions.