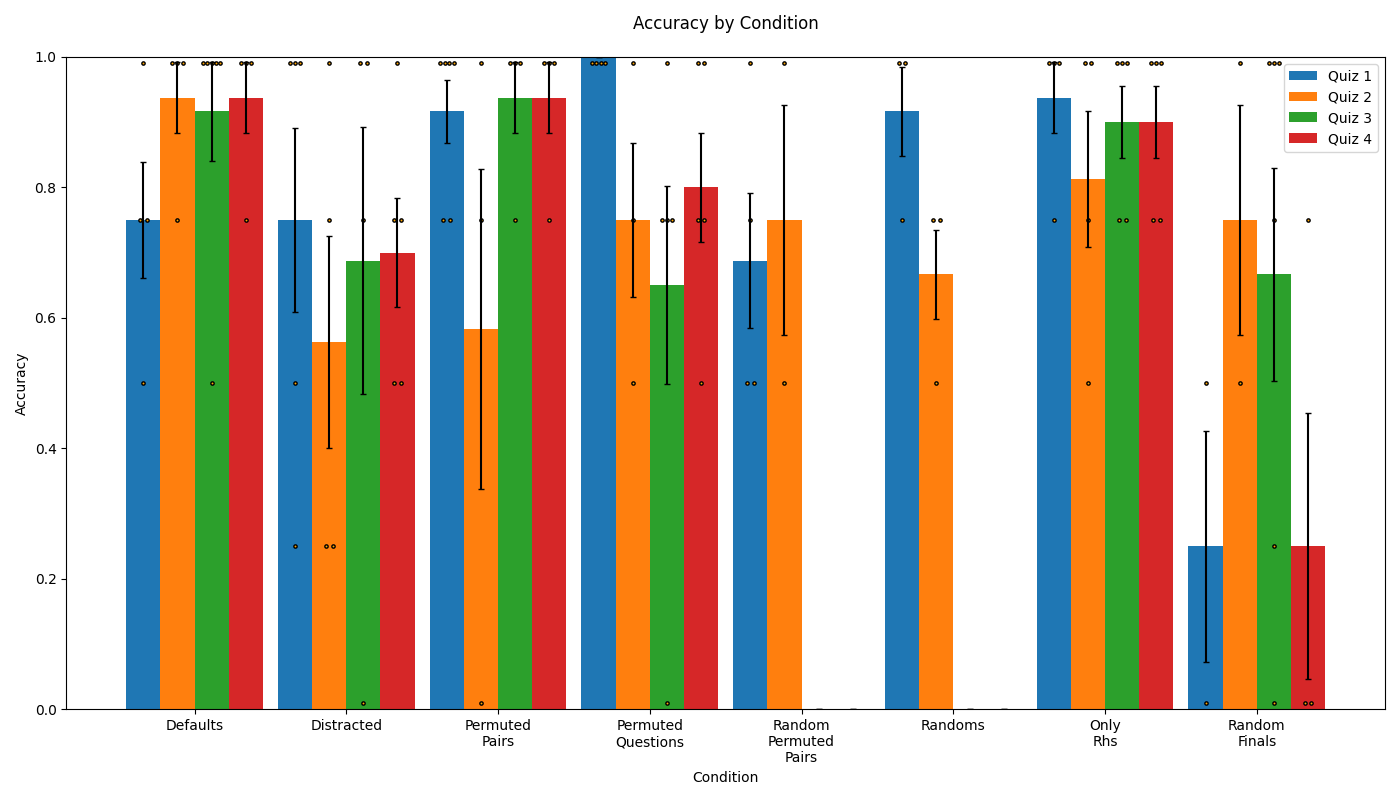
## Bar Chart: Accuracy by Condition
### Overview
The image is a bar chart comparing the accuracy of four quizzes under different conditions. The chart displays the mean accuracy for each quiz within each condition, with error bars indicating the variability.
### Components/Axes
* **Title:** Accuracy by Condition
* **Y-axis:** Accuracy, ranging from 0.0 to 1.0 in increments of 0.2.
* **X-axis:** Condition, with the following categories: Defaults, Distracted, Permuted Pairs, Permuted Questions, Random Permuted Pairs, Randoms, Only Rhs, Random Finals.
* **Legend:** Located in the top-right corner, the legend identifies the quizzes:
* Quiz 1 (Blue)
* Quiz 2 (Orange)
* Quiz 3 (Green)
* Quiz 4 (Red)
### Detailed Analysis
The chart presents accuracy data for four quizzes across eight different conditions. Each condition has four bars representing the accuracy of each quiz. Error bars are present on each bar, indicating the standard deviation or confidence interval.
**Condition: Defaults**
* Quiz 1 (Blue): Accuracy ~0.75
* Quiz 2 (Orange): Accuracy ~0.92
* Quiz 3 (Green): Accuracy ~0.90
* Quiz 4 (Red): Accuracy ~0.93
**Condition: Distracted**
* Quiz 1 (Blue): Accuracy ~0.75
* Quiz 2 (Orange): Accuracy ~0.57
* Quiz 3 (Green): Accuracy ~0.69
* Quiz 4 (Red): Accuracy ~0.70
**Condition: Permuted Pairs**
* Quiz 1 (Blue): Accuracy ~0.92
* Quiz 2 (Orange): Accuracy ~0.59
* Quiz 3 (Green): Accuracy ~0.93
* Quiz 4 (Red): Accuracy ~0.94
**Condition: Permuted Questions**
* Quiz 1 (Blue): Accuracy ~1.0
* Quiz 2 (Orange): Accuracy ~0.65
* Quiz 3 (Green): Accuracy ~0.65
* Quiz 4 (Red): Accuracy ~0.80
**Condition: Random Permuted Pairs**
* Quiz 1 (Blue): Accuracy ~0.70
* Quiz 2 (Orange): Accuracy ~0.75
* Quiz 3 (Green): Accuracy ~0.50
* Quiz 4 (Red): Accuracy ~0.70
**Condition: Randoms**
* Quiz 1 (Blue): Accuracy ~0.92
* Quiz 2 (Orange): Accuracy ~0.67
* Quiz 3 (Green): Accuracy ~0.0
* Quiz 4 (Red): Accuracy ~0.0
**Condition: Only Rhs**
* Quiz 1 (Blue): Accuracy ~0.94
* Quiz 2 (Orange): Accuracy ~0.82
* Quiz 3 (Green): Accuracy ~0.90
* Quiz 4 (Red): Accuracy ~0.90
**Condition: Random Finals**
* Quiz 1 (Blue): Accuracy ~0.25
* Quiz 2 (Orange): Accuracy ~0.67
* Quiz 3 (Green): Accuracy ~0.50
* Quiz 4 (Red): Accuracy ~0.25
### Key Observations
* Quiz 1 (Blue) generally shows high accuracy in "Defaults", "Permuted Pairs", "Permuted Questions", "Randoms", and "Only Rhs" conditions, but significantly lower accuracy in "Distracted" and "Random Finals" conditions.
* Quiz 2 (Orange) shows relatively consistent accuracy across "Defaults", "Distracted", "Permuted Pairs", "Permuted Questions", and "Random Permuted Pairs" conditions, but lower accuracy in "Randoms" and "Random Finals" conditions.
* Quiz 3 (Green) and Quiz 4 (Red) show high accuracy in "Defaults", "Permuted Pairs", and "Only Rhs" conditions.
* The "Randoms" condition results in very low accuracy for Quizzes 3 and 4.
* The "Random Finals" condition results in low accuracy for Quizzes 1 and 4.
### Interpretation
The data suggests that the different conditions have varying impacts on the accuracy of the quizzes. The "Distracted" and "Random Finals" conditions seem to negatively affect the accuracy of Quiz 1, while the "Randoms" condition significantly reduces the accuracy of Quizzes 3 and 4. The "Defaults", "Permuted Pairs", "Permuted Questions", and "Only Rhs" conditions generally result in high accuracy across all quizzes. This indicates that the specific conditions of the quizzes play a crucial role in determining the overall accuracy. The error bars provide insight into the variability of the data, suggesting the reliability of the observed trends.