```markdown
## Bar Chart: Accuracy by Condition
### Overview
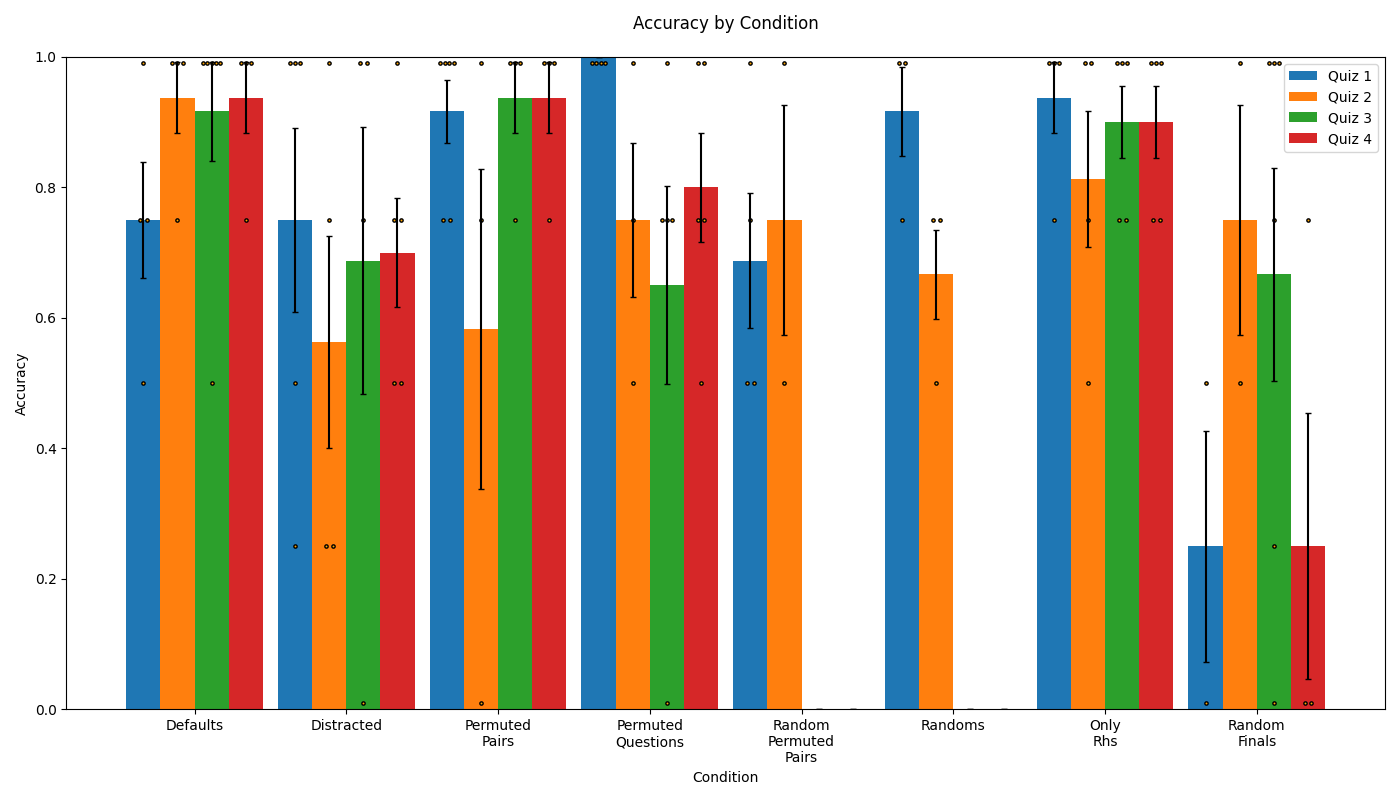
The chart compares the accuracy of four quizzes (Q1-Q4) across eight experimental conditions: Defaults, Distracted, Permuted Pairs, Permuted Questions, Random Permuted Pairs, Randoms, Only Rhs, and Random Finals. Each condition is represented by grouped bars in blue (Q1), orange (Q2), green (Q3), and red (Q4), with error bars indicating variability.
### Components/Axes
- **X-axis (Condition)**: Eight categories (Defaults, Distracted, Permuted Pairs, Permuted Questions, Random Permuted Pairs, Randoms, Only Rhs, Random Finals).
- **Y-axis (Accuracy)**: Scale from 0.0 to 1.0.
- **Legend**: Located on the right, mapping colors to quizzes:
- Blue = Quiz 1
- Orange = Quiz 2
- Green = Quiz 3
- Red = Quiz 4
- **Error Bars**: Vertical lines atop each bar, representing standard error.
### Detailed Analysis
1. **Defaults**:
- Q1: ~0.75 (±0.08)
- Q2: ~0.93 (±0.05)
- Q3: ~0.91 (±0.04)
- Q4: ~0.94 (±0.03)
2. **Distracted**:
- Q1: ~0.75 (±0.08)
- Q2: ~0.57 (±0.07)
- Q3: ~0.69 (±0.06)
- Q4: ~0.71 (±0.05)
3. **Permuted Pairs**:
- Q1: ~0.92 (±0.04)
- Q2: ~0.59 (±0.06)
- Q3: ~0.94 (±0.03)
- Q4: ~0.94 (±0.03)
4. **Permuted Questions**:
- Q1: ~1.00 (±0.00)
- Q2: ~0.76 (±0.06)
- Q3: ~0.66 (±0.05)
- Q4: ~0.80 (±0.05)
5. **Random Permuted Pairs**:
- Q1: ~0.70 (±0.06)
- Q2: ~0.76 (±0.05)
6. **Randoms**:
- Q1: ~0.92 (±0.04)
- Q2: ~0.67 (±0.05)
7. **Only Rhs**:
- Q1: ~0.94 (±0.03)
- Q2: ~0.81 (±0.04)
- Q3: ~0.90 (±0.03)
- Q4: ~0.90 (±0.03)
8. **Random Finals**:
- Q1: ~0.25 (±0.05)
- Q2: ~0.75 (±0.05)
- Q3: ~0.67 (±0.05)
- Q4: ~0.25 (±0.05)
### Key Observations
- **Highest Accuracy**:
- Q1 excels in **Permuted Questions** (~1.00).
- Q2 performs best in **Defaults** (~0.93).
- Q3 and Q4 peak in **Defaults** (~0.91–0.94) and **Permuted Pairs** (~0.94).
- **Lowest Accuracy**:
- Q1 and Q4 drop sharply in **Random Finals** (~0.25).
- **Error Variability**:
- Largest error bars in **Distracted** (Q1: ±0.08) and **Random Finals** (Q1/Q4: ±0.05).
- **Consistency**:
- Q3 and Q4 show similar performance across most conditions, except **Distracted** and **Random Finals**.
### Interpretation
The data suggests that:
1. **Study Design Impacts