## Line Chart: Pass@t vs. Consumed Tokens for Different Models and Prompting Strategies
### Overview
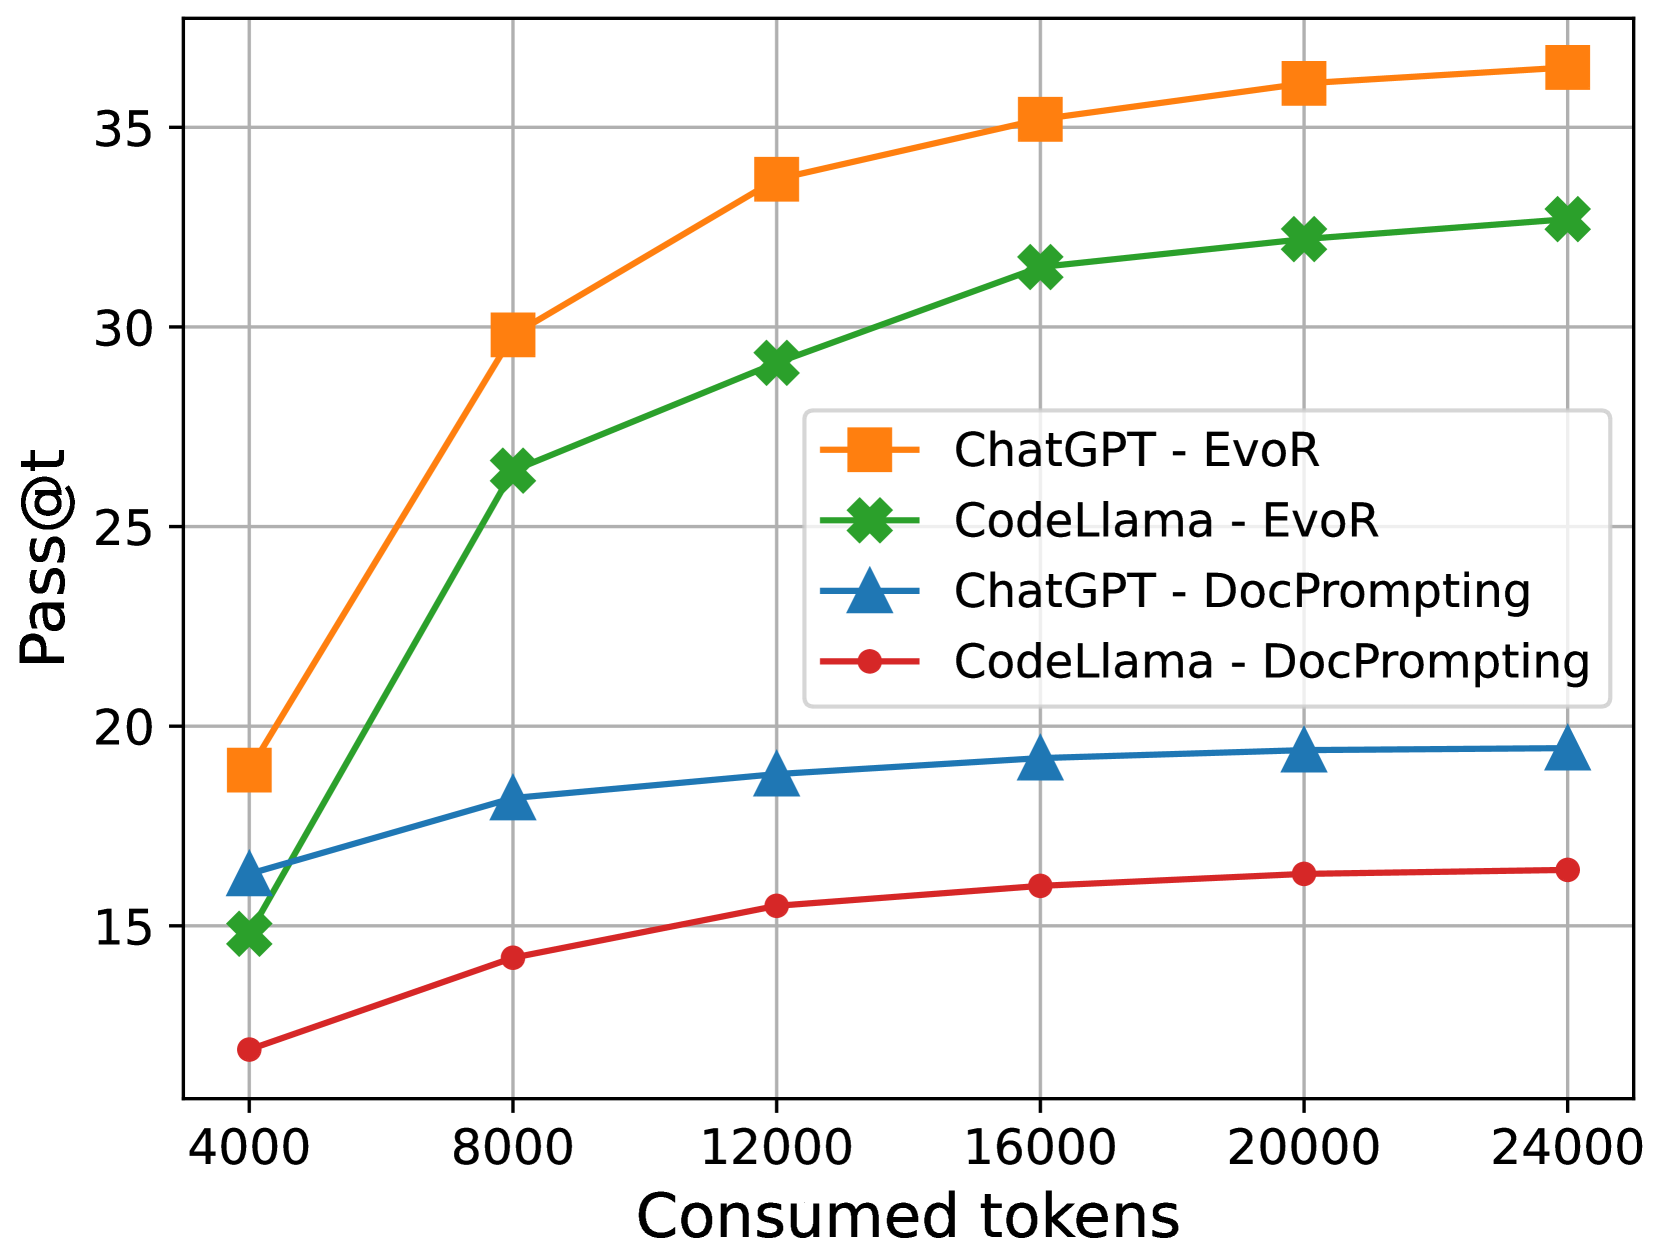
The image is a line chart comparing the performance of ChatGPT and CodeLlama models using two different prompting strategies (EvoR and DocPrompting). The chart plots "Pass@t" (y-axis) against "Consumed tokens" (x-axis). The performance is measured by the Pass@t metric, which represents the probability of generating a correct solution within 't' attempts. The x-axis represents the number of tokens consumed during the generation process.
### Components/Axes
* **X-axis:** "Consumed tokens" ranging from 4000 to 24000, with increments of 4000.
* **Y-axis:** "Pass@t" ranging from 15 to 35, with increments of 5.
* **Legend (Center-Right):**
* Orange line with square markers: "ChatGPT - EvoR"
* Green line with cross markers: "CodeLlama - EvoR"
* Blue line with triangle markers: "ChatGPT - DocPrompting"
* Red line with circle markers: "CodeLlama - DocPrompting"
### Detailed Analysis
* **ChatGPT - EvoR (Orange):** The line starts at approximately (4000, 19) and increases rapidly until around 12000 tokens, then the increase slows down. The data points are approximately:
* (4000, 19)
* (8000, 30)
* (12000, 34)
* (16000, 35)
* (20000, 36)
* (24000, 36.5)
* **CodeLlama - EvoR (Green):** The line starts at approximately (4000, 15) and increases steadily until around 24000 tokens. The data points are approximately:
* (4000, 15)
* (8000, 26.5)
* (12000, 29)
* (16000, 31.5)
* (20000, 32.3)
* (24000, 33)
* **ChatGPT - DocPrompting (Blue):** The line starts at approximately (4000, 16) and increases slightly, plateauing after 12000 tokens. The data points are approximately:
* (4000, 16)
* (8000, 18)
* (12000, 18.5)
* (16000, 19)
* (20000, 19.2)
* (24000, 19.3)
* **CodeLlama - DocPrompting (Red):** The line starts at approximately (4000, 12) and increases slightly, plateauing after 16000 tokens. The data points are approximately:
* (4000, 12)
* (8000, 14.2)
* (12000, 15.5)
* (16000, 16)
* (20000, 16.3)
* (24000, 16.5)
### Key Observations
* ChatGPT with EvoR prompting (orange line) consistently outperforms all other configurations across the range of consumed tokens.
* CodeLlama with EvoR prompting (green line) performs better than both models using DocPrompting.
* Both models using DocPrompting (blue and red lines) show significantly lower Pass@t values and plateau quickly.
* The performance gain from increasing consumed tokens diminishes for all configurations, especially after 16000 tokens.
### Interpretation
The chart suggests that the choice of prompting strategy (EvoR vs. DocPrompting) has a significant impact on the performance of both ChatGPT and CodeLlama models. EvoR prompting leads to substantially higher Pass@t values compared to DocPrompting. ChatGPT, when combined with EvoR, achieves the highest performance, indicating a strong synergy between the model architecture and the prompting technique. The diminishing returns observed with increasing consumed tokens suggest that there is a point beyond which additional tokens do not significantly improve the probability of generating a correct solution. This could be due to the models reaching their capacity to extract relevant information or the generation process becoming less efficient with longer sequences. The DocPrompting strategy appears to be less effective in leveraging the capabilities of these models, possibly due to limitations in how the prompts are structured or the type of information they convey.