## Line Chart: Reward vs. Step Number for Two RL Models
### Overview
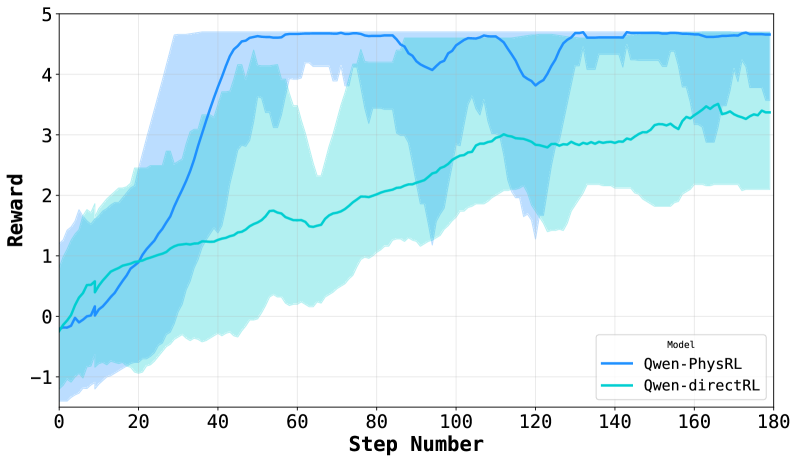
The image is a line chart comparing the performance of two reinforcement learning (RL) models, "Qwen-PhysRL" and "Qwen-directRL," based on their reward achieved over a number of steps. The chart displays the average reward for each model, along with a shaded region indicating the variance or uncertainty around the average.
### Components/Axes
* **X-axis:** "Step Number," ranging from 0 to 180 in increments of 20.
* **Y-axis:** "Reward," ranging from -1 to 5 in increments of 1.
* **Legend:** Located in the bottom-right corner, it identifies the two models:
* "Qwen-PhysRL" (darker blue line)
* "Qwen-directRL" (lighter blue/cyan line)
* The chart includes a light grid for easier value reading.
### Detailed Analysis
* **Qwen-PhysRL (darker blue):**
* **Trend:** The line starts around -0.2 reward at step 0, then rapidly increases to approximately 4.5 reward by step 40. It plateaus around 4.5-4.8 reward from step 40 to 180, with some minor fluctuations.
* **Variance:** The shaded region around the "Qwen-PhysRL" line is wider in the initial steps (0-40), indicating higher variance in the reward during the learning phase. The variance decreases significantly after step 40.
* **Data Points:**
* Step 0: Reward ≈ -0.2
* Step 20: Reward ≈ 1.5
* Step 40: Reward ≈ 4.5
* Step 100: Reward ≈ 4.8
* Step 180: Reward ≈ 4.7
* **Qwen-directRL (lighter blue/cyan):**
* **Trend:** The line starts around 0 reward at step 0, gradually increases to approximately 3.3 reward by step 160.
* **Variance:** The shaded region around the "Qwen-directRL" line is generally wider than that of "Qwen-PhysRL," indicating higher variance throughout the training process.
* **Data Points:**
* Step 0: Reward ≈ 0
* Step 20: Reward ≈ 0.8
* Step 40: Reward ≈ 1.7
* Step 100: Reward ≈ 2.8
* Step 160: Reward ≈ 3.3
### Key Observations
* "Qwen-PhysRL" achieves a significantly higher reward than "Qwen-directRL" after the initial learning phase.
* "Qwen-PhysRL" converges faster, reaching its peak performance around step 40, while "Qwen-directRL" continues to improve gradually.
* "Qwen-PhysRL" exhibits lower variance in reward after the initial learning phase, suggesting more stable performance.
### Interpretation
The chart demonstrates that "Qwen-PhysRL" outperforms "Qwen-directRL" in terms of reward achieved and stability. The rapid increase in reward for "Qwen-PhysRL" in the early steps suggests that it learns more efficiently than "Qwen-directRL." The lower variance in reward for "Qwen-PhysRL" after the initial learning phase indicates that it is more consistent in its performance. The data suggests that incorporating physical reasoning ("PhysRL") into the RL model leads to better and more stable performance compared to a direct RL approach. The wider variance bands for "Qwen-directRL" indicate that its performance is more sensitive to the specific training episodes or environmental conditions.