\n
## Line Chart: Reward vs. Step Number
### Overview
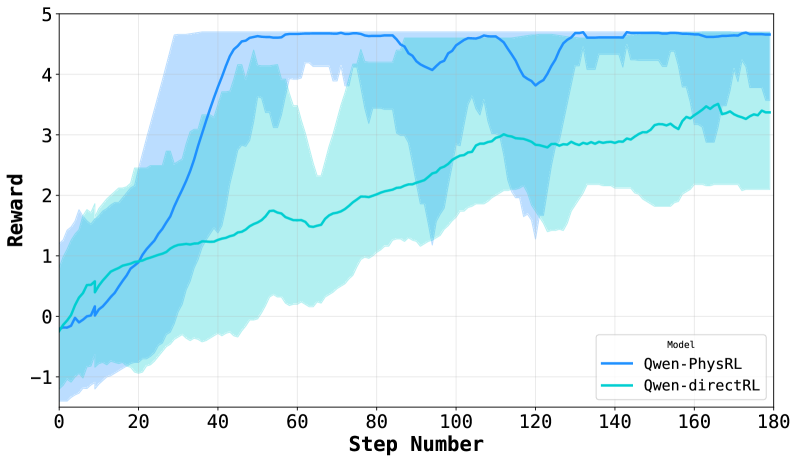
This image presents a line chart comparing the reward obtained by two models, "Qwen-PhysRL" and "Qwen-directRL", over a series of steps. The chart displays the mean reward for each model, along with a shaded region representing the standard deviation or confidence interval around the mean.
### Components/Axes
* **X-axis:** "Step Number", ranging from 0 to 180.
* **Y-axis:** "Reward", ranging from -1 to 5.
* **Legend:** Located in the bottom-right corner, identifying the two models:
* "Qwen-PhysRL" (represented by a blue line)
* "Qwen-directRL" (represented by a cyan line)
* **Data Series:** Two lines representing the reward for each model over the step number. Shaded areas indicate the variance around each line.
### Detailed Analysis
**Qwen-PhysRL (Blue Line):**
The blue line representing Qwen-PhysRL shows an upward trend, starting at approximately -0.2 at Step 0. The line increases relatively quickly to around 1.5 at Step 20, then continues to rise more gradually, reaching approximately 4.3 by Step 60. It fluctuates between approximately 4.0 and 4.7 for the remainder of the steps, ending at approximately 4.5 at Step 180.
**Qwen-directRL (Cyan Line):**
The cyan line representing Qwen-directRL also shows an upward trend, but it is less pronounced than that of Qwen-PhysRL. It starts at approximately -0.4 at Step 0 and increases to around 0.8 at Step 20. The line continues to rise, reaching approximately 3.2 by Step 60. It fluctuates between approximately 2.8 and 3.8 for the remainder of the steps, ending at approximately 3.4 at Step 180. The shaded area around this line is significantly larger than that of Qwen-PhysRL, indicating greater variance.
**Approximate Data Points (extracted from visual inspection):**
| Step Number | Qwen-PhysRL (Reward) | Qwen-directRL (Reward) |
|-------------|-----------------------|------------------------|
| 0 | -0.2 | -0.4 |
| 20 | 1.5 | 0.8 |
| 40 | 3.0 | 2.0 |
| 60 | 4.3 | 3.2 |
| 80 | 4.5 | 3.0 |
| 100 | 4.2 | 3.3 |
| 120 | 4.6 | 3.6 |
| 140 | 4.4 | 3.5 |
| 160 | 4.5 | 3.4 |
| 180 | 4.5 | 3.4 |
### Key Observations
* Qwen-PhysRL consistently achieves a higher reward than Qwen-directRL throughout the entire range of steps.
* The variance in reward for Qwen-directRL is significantly higher than that for Qwen-PhysRL, as indicated by the larger shaded area.
* Both models exhibit a diminishing rate of reward increase as the step number increases, suggesting a convergence towards a stable reward level.
* The initial learning phase (Steps 0-20) shows the most significant reward gains for both models.
### Interpretation
The data suggests that the Qwen-PhysRL model is more effective at learning the task than the Qwen-directRL model, as evidenced by its consistently higher reward. The lower variance in Qwen-PhysRL's reward indicates that its performance is more stable and predictable. The diminishing rate of reward increase suggests that both models are approaching a point of optimal performance. The larger variance in Qwen-directRL could indicate that it is more sensitive to initial conditions or requires more training data to achieve stable performance. The initial rapid increase in reward for both models likely represents the initial learning phase where the models are quickly acquiring basic skills. The difference in performance between the two models could be attributed to the specific training methodologies or architectures employed.