\n
## Line Chart: Reward vs. Step Number for Two RL Models
### Overview
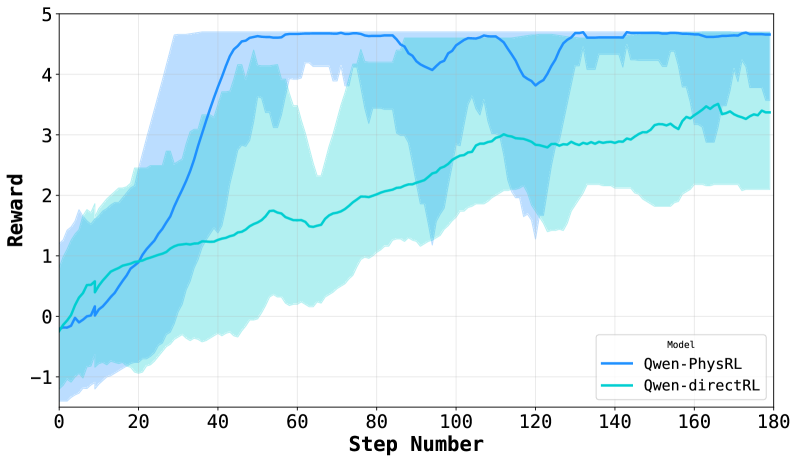
The image is a line chart comparing the training performance of two reinforcement learning (RL) models over 180 steps. The chart plots the "Reward" achieved on the y-axis against the "Step Number" on the x-axis. Each model's performance is represented by a solid line, surrounded by a shaded area of the same color, which likely indicates the variance, standard deviation, or confidence interval across multiple training runs.
### Components/Axes
* **Chart Type:** Line chart with shaded confidence intervals.
* **X-Axis:**
* **Label:** "Step Number"
* **Scale:** Linear, ranging from 0 to 180.
* **Major Tick Marks:** At intervals of 20 (0, 20, 40, 60, 80, 100, 120, 140, 160, 180).
* **Y-Axis:**
* **Label:** "Reward"
* **Scale:** Linear, ranging from -1 to 5.
* **Major Tick Marks:** At integer intervals (-1, 0, 1, 2, 3, 4, 5).
* **Legend:**
* **Position:** Bottom-right corner of the plot area.
* **Title:** "Model"
* **Entries:**
1. **Qwen-PhysRL:** Represented by a dark blue solid line and a light blue shaded area.
2. **Qwen-directRL:** Represented by a teal (blue-green) solid line and a light teal shaded area.
### Detailed Analysis
**1. Qwen-PhysRL (Dark Blue Line & Light Blue Shading):**
* **Trend:** The line shows a very steep, rapid increase in reward early in training, followed by a plateau with moderate fluctuations.
* **Key Data Points (Approximate):**
* Step 0: Reward ≈ 0.
* Step 20: Reward ≈ 1.0.
* Step 40: Reward ≈ 4.5 (steep ascent complete).
* Step 60: Reward ≈ 4.7 (local peak).
* Step 100: Reward ≈ 4.2 (local trough).
* Step 120: Reward ≈ 3.8 (local trough).
* Step 140: Reward ≈ 4.7 (local peak).
* Step 180: Reward ≈ 4.7.
* **Shaded Area (Variance):** The light blue shaded region is very wide during the initial ascent (steps 0-40), indicating high variance between runs. After step 40, the shaded area narrows considerably but remains present, showing that while the mean reward stabilizes, there is still some run-to-run variability.
**2. Qwen-directRL (Teal Line & Light Teal Shading):**
* **Trend:** The line shows a steadier, more gradual, and roughly linear increase in reward throughout the entire training period.
* **Key Data Points (Approximate):**
* Step 0: Reward ≈ -0.5.
* Step 20: Reward ≈ 0.8.
* Step 60: Reward ≈ 1.5.
* Step 100: Reward ≈ 2.5.
* Step 140: Reward ≈ 3.0.
* Step 180: Reward ≈ 3.4.
* **Shaded Area (Variance):** The light teal shaded region is consistently wide across the entire x-axis. This indicates a high and persistent level of variance in the reward achieved by this model across different training runs, from start to finish.
### Key Observations
1. **Performance Gap:** Qwen-PhysRL achieves a significantly higher final reward (~4.7) compared to Qwen-directRL (~3.4) by step 180.
2. **Learning Speed:** Qwen-PhysRL learns much faster, reaching near-peak performance by step 40. Qwen-directRL's learning is slower and more incremental.
3. **Stability/Variance:** Qwen-PhysRL exhibits high initial variance that decreases after convergence. Qwen-directRL shows high variance throughout training, suggesting less consistent performance across runs.
4. **Convergence:** Qwen-PhysRL's reward curve plateaus after step 40, indicating convergence. Qwen-directRL's curve is still trending upward at step 180, suggesting it may not have fully converged.
### Interpretation
This chart demonstrates a clear performance comparison between two RL training approaches. **Qwen-PhysRL** appears to be a more sample-efficient and effective method for this task, rapidly converging to a high reward level. The name "PhysRL" might suggest it incorporates physical priors or constraints, which could explain the faster, more stable learning once a viable policy is found (post step 40).
**Qwen-directRL**, in contrast, learns slowly and unreliably. The persistently wide confidence interval suggests the training process is highly sensitive to initial conditions or random seeds, making it a less robust method for this specific problem. The upward trend at the end implies that with more training steps, its performance might continue to improve, but it would likely remain less efficient than the PhysRL variant.
The data suggests that for the task being measured, incorporating the inductive biases present in the "PhysRL" approach leads to superior learning dynamics—both in terms of final performance and training stability—compared to a more "direct" RL approach.