# Technical Document Extraction: Probability Density Function Graph
## 1. Labels and Axis Titles
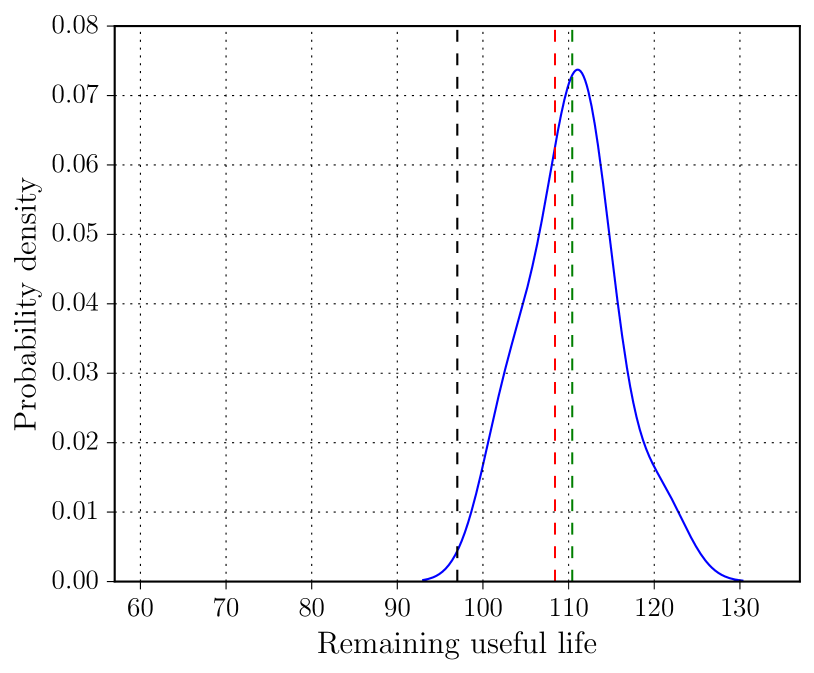
- **X-Axis**: "Remaining useful life" (numerical scale: 60 to 130, increments of 10)
- **Y-Axis**: "Probability density" (numerical scale: 0.00 to 0.08, increments of 0.01)
- **Legend**: Located on the right side of the plot, outside the main chart area.
## 2. Key Components
### Main Chart
- **Blue Curve**: Represents the probability density function (PDF) of remaining useful life.
- **Peak**: At **x = 110**, with a probability density of approximately **0.075**.
- **Trend**:
- Starts near 0 at x = 60.
- Increases monotonically to the peak at x = 110.
- Decreases monotonically after x = 110, approaching 0 at x = 130.
### Dashed Reference Lines
1. **Black Dashed Line**: Vertical line at **x = 100**.
2. **Red Dashed Line**: Vertical line at **x = 110** (aligns with the PDF peak).
3. **Green Dashed Line**: Vertical line at **x = 115**.
## 3. Legend
- **Color-Coded Labels**:
- **Black**: Dashed line at x = 100.
- **Red**: Dashed line at x = 110.
- **Green**: Dashed line at x = 115.
## 4. Spatial Grounding
- **Legend Placement**: Right-aligned, outside the main plot area (no overlap with data).
- **Data Point Verification**:
- Blue curve peak at x = 110 matches the red dashed line.
- Black dashed line at x = 100 is to the left of the peak.
- Green dashed line at x = 115 is to the right of the peak.
## 5. Trend Verification
- **Blue Curve**:
- Symmetrical bell-shaped distribution centered at x = 110.
- Probability density decreases by ~0.015 per unit increase in x beyond the peak (e.g., 0.075 at x = 110 → 0.06 at x = 120).
- **Dashed Lines**: Static vertical markers; no trend.
## 6. Component Isolation
- **Header**: Axis labels and scale definitions.
- **Main Chart**: Blue curve and three dashed lines.
- **Footer**: Legend with color-coded labels.
## 7. Data Table Reconstruction
No explicit data table is present. The graph visually represents the PDF, with key data points inferred from the curve and reference lines.
## 8. Missing Elements
- No chart title or subtitle.
- No annotations or textual explanations within the plot area.
## 9. Language and Translation
- All text is in English. No non-English content detected.