\n
## Chart: Attention Weight Comparison with and without Meaningless Tokens
### Overview
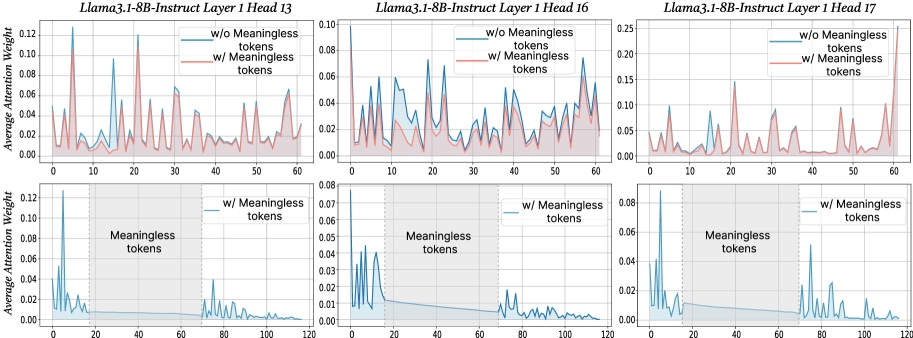
This image presents six line charts comparing the average attention weight for two conditions: with and without "meaningless tokens". The charts are arranged in a 2x3 grid, each representing a different layer and head of the Llama3.1-8B-Instruct model (Layer 13, 16, and 17, each with two sub-charts). The x-axis represents token position, and the y-axis represents the average attention weight.
### Components/Axes
* **Title:** Each chart is titled "Llama3.1-8B-Instruct Layer [Number] Head [Number]".
* **X-axis Label:** "Token Position" (ranging from 0 to approximately 120, depending on the chart).
* **Y-axis Label:** "Average Attention Weight" (ranging from 0 to approximately 0.25, depending on the chart).
* **Legend:** Each chart has a legend with two entries:
* "w/o Meaningless tokens" (represented by a blue line)
* "w/ Meaningless tokens" (represented by a red line)
* **Sub-chart Labels:** The bottom row of charts are labeled "Meaningless tokens".
### Detailed Analysis
**Chart 1: Llama3.1-8B-Instruct Layer 13 Head 13**
* **w/o Meaningless tokens (Blue Line):** The line fluctuates significantly between approximately 0.00 and 0.12. There are numerous peaks and valleys.
* **w/ Meaningless tokens (Red Line):** The line also fluctuates, but generally remains lower than the blue line, ranging from approximately 0.00 to 0.08.
* **Trend:** Both lines exhibit high variability.
**Chart 2: Llama3.1-8B-Instruct Layer 16 Head 16**
* **w/o Meaningless tokens (Blue Line):** The line shows a decreasing trend from approximately 0.08 to approximately 0.02, with some fluctuations.
* **w/ Meaningless tokens (Red Line):** The line is relatively flat, hovering around 0.04.
* **Trend:** The blue line demonstrates a clear downward trend, while the red line is stable.
**Chart 3: Llama3.1-8B-Instruct Layer 17 Head 17**
* **w/o Meaningless tokens (Blue Line):** The line fluctuates significantly, ranging from approximately 0.00 to 0.25.
* **w/ Meaningless tokens (Red Line):** The line fluctuates, but generally remains lower than the blue line, ranging from approximately 0.00 to 0.10.
* **Trend:** Both lines exhibit high variability.
**Chart 4: w/ Meaningless tokens (Layer 13 Head 13)**
* **w/ Meaningless tokens (Blue Line):** The line shows a decreasing trend from approximately 0.12 to approximately 0.02, with some fluctuations.
* **Trend:** The blue line demonstrates a clear downward trend.
**Chart 5: w/ Meaningless tokens (Layer 16 Head 16)**
* **w/ Meaningless tokens (Blue Line):** The line shows a decreasing trend from approximately 0.07 to approximately 0.03, with some fluctuations.
* **Trend:** The blue line demonstrates a clear downward trend.
**Chart 6: w/ Meaningless tokens (Layer 17 Head 17)**
* **w/ Meaningless tokens (Blue Line):** The line fluctuates significantly, ranging from approximately 0.00 to 0.08.
* **Trend:** The blue line exhibits high variability.
### Key Observations
* The attention weights generally decrease as the token position increases, particularly in the charts focusing on "w/ Meaningless tokens".
* The inclusion of meaningless tokens appears to reduce the overall attention weight in some layers (e.g., Layer 16).
* Layer 17 exhibits the highest variability in attention weights, regardless of the presence of meaningless tokens.
* The top row of charts (w/o Meaningless tokens) shows more pronounced fluctuations in attention weights compared to the bottom row (w/ Meaningless tokens).
### Interpretation
The data suggests that the introduction of meaningless tokens impacts the attention mechanism within the Llama3.1-8B-Instruct model. The decreasing trend in attention weights with the inclusion of meaningless tokens (particularly in Layer 16) could indicate that the model is less focused on relevant information when presented with these tokens. The high variability in Layer 17 might suggest that this layer is more sensitive to input variations or has a more complex attention pattern. The comparison between the top and bottom rows highlights how the presence of meaningless tokens can dampen the attention fluctuations, potentially leading to a more stable but less nuanced attention distribution. This could have implications for the model's ability to process and understand complex sequences. The charts provide insights into how the model allocates attention resources and how these resources are affected by the quality of the input data.