## Bar Charts: Token Frequency Distribution for Questions and Answers
### Overview
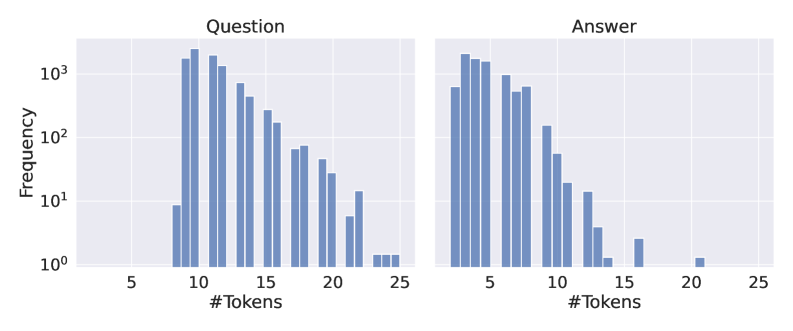
The image contains two side-by-side bar charts comparing the frequency distribution of token counts in questions and answers. Both charts use a logarithmic y-axis scale (10⁰ to 10³) and linear x-axis scale (#Tokens from 5 to 25). The charts reveal distinct patterns in how token counts are distributed across questions versus answers.
### Components/Axes
- **X-axis (Horizontal):**
- Label: "#Tokens"
- Scale: Linear from 5 to 25 tokens
- Tick marks at every 5-token interval (5, 10, 15, 20, 25)
- **Y-axis (Vertical):**
- Label: "Frequency"
- Scale: Logarithmic (10⁰ to 10³)
- Tick marks at 10⁰, 10¹, 10², 10³
- **Legend:**
- No explicit legend present, but color coding is consistent:
- **Blue bars:** Represent both question and answer distributions
- **Chart Titles:**
- Left chart: "Question"
- Right chart: "Answer"
### Detailed Analysis
#### Question Chart
- **Peak Frequency:**
- Highest frequency (~10³) occurs at 10 tokens
- Secondary peak at 12 tokens (~800 frequency)
- **Distribution Pattern:**
- Frequencies decrease monotonically after 12 tokens
- At 20 tokens: ~10¹ frequency
- At 25 tokens: ~10⁰ frequency (1 occurrence)
- **Notable:**
- No bars visible between 5-9 tokens
- All bars are blue with consistent width
#### Answer Chart
- **Peak Frequency:**
- Highest frequency (~10³) occurs at 5 tokens
- Secondary peak at 7 tokens (~800 frequency)
- **Distribution Pattern:**
- Sharp decline after 7 tokens
- At 10 tokens: ~10² frequency
- At 15 tokens: ~10¹ frequency
- At 20 tokens: ~10⁰ frequency
- **Notable:**
- No bars visible between 5-7 tokens
- All bars are blue with consistent width
### Key Observations
1. **Length Distribution:**
- Questions cluster around 10-12 tokens (peak frequency)
- Answers cluster around 5-7 tokens (peak frequency)
2. **Long-Tail Behavior:**
- Both distributions show rapid decay beyond 15 tokens
- Frequencies drop by 2 orders of magnitude between 10-20 tokens
3. **Symmetry:**
- Answer distribution is more concentrated (narrower peak)
- Question distribution is slightly broader but still right-skewed
4. **Logarithmic Scale Impact:**
- Visualizes power-law distribution effectively
- Highlights dominance of short texts over long ones
### Interpretation
The data demonstrates a clear preference for brevity in both questions and answers, with shorter texts being exponentially more frequent. This aligns with natural language processing patterns where most human-generated text follows a power-law distribution. The question distribution shows slightly more variability in length compared to answers, suggesting answers may be more tightly constrained in length (e.g., through system design or user expectations). The logarithmic scale is critical for visualizing these distributions, as linear scaling would obscure the long-tail behavior. The absence of data points between 5-9 tokens in both charts suggests either a minimum length requirement or natural clustering around specific token counts. This pattern could inform system design decisions regarding token limits or text processing pipelines.