## Chart Type: Multiple Line and Bar Charts
### Overview
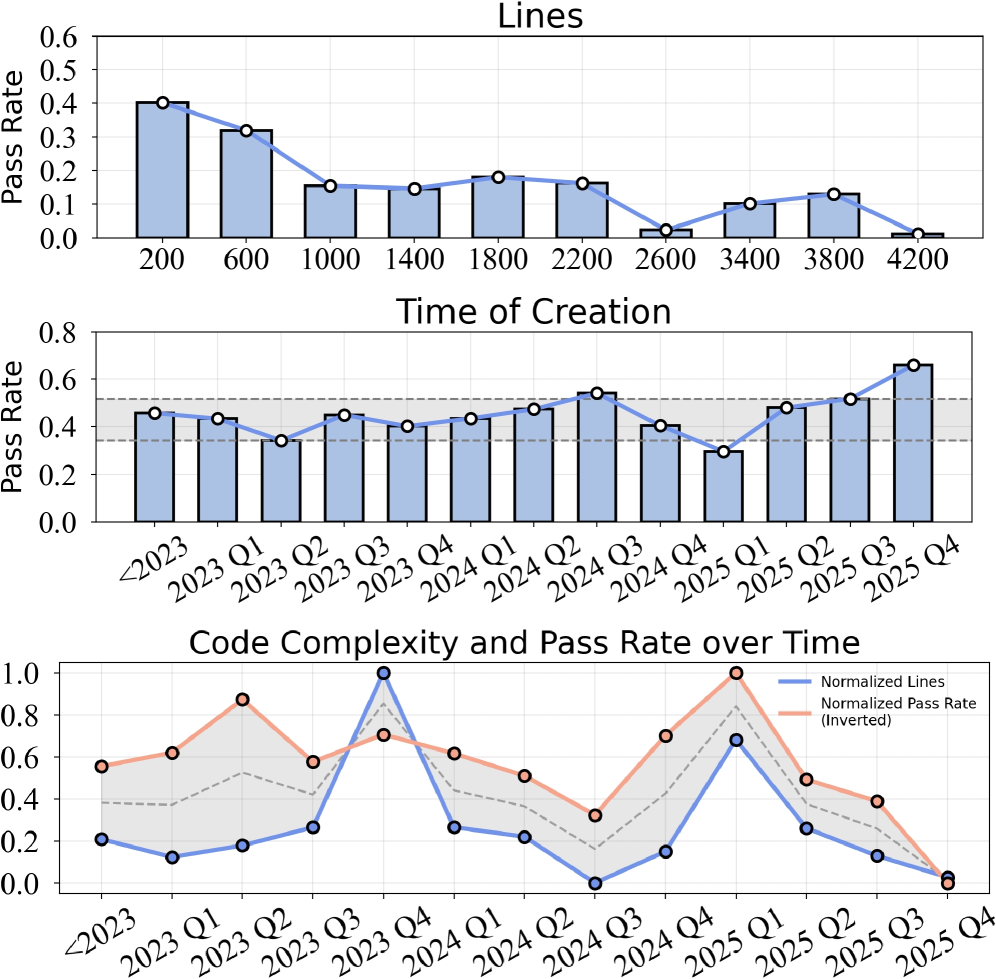
The image presents three charts examining "Pass Rate" in relation to different factors: "Lines", "Time of Creation", and "Code Complexity and Pass Rate over Time". The first two charts are bar charts overlaid with lines, while the third chart is a line chart.
### Components/Axes
**Chart 1: Lines**
* **Title:** Lines
* **Y-axis:** Pass Rate, ranging from 0.0 to 0.6, incrementing by 0.1.
* **X-axis:** Time of Creation, with values 200, 600, 1000, 1400, 1800, 2200, 2600, 3400, 3800, 4200.
* **Data:** Blue bars representing pass rate at different "Time of Creation" values, overlaid with a blue line connecting the tops of the bars.
**Chart 2: Time of Creation**
* **Title:** Time of Creation
* **Y-axis:** Pass Rate, ranging from 0.0 to 0.8, incrementing by 0.2.
* **X-axis:** Time periods: "<2023", "2023 Q1", "2023 Q2", "2023 Q3", "2023 Q4", "2024 Q1", "2024 Q2", "2024 Q3", "2024 Q4", "2025 Q1", "2025 Q2", "2025 Q3", "2025 Q4".
* **Data:** Blue bars representing pass rate for each time period, overlaid with a blue line connecting the tops of the bars. Two horizontal dashed lines are present at approximately y=0.4 and y=0.5. A shaded grey region exists between these two lines.
**Chart 3: Code Complexity and Pass Rate over Time**
* **Title:** Code Complexity and Pass Rate over Time
* **Y-axis:** Ranging from 0.0 to 1.0, incrementing by 0.2.
* **X-axis:** Time periods: "<2023", "2023 Q1", "2023 Q2", "2023 Q3", "2023 Q4", "2024 Q1", "2024 Q2", "2024 Q3", "2024 Q4", "2025 Q1", "2025 Q2", "2025 Q3", "2025 Q4".
* **Data:**
* **Blue Line:** "Normalized Lines"
* **Red Line:** "Normalized Pass Rate (Inverted)"
* A shaded grey region exists between the two lines.
### Detailed Analysis
**Chart 1: Lines**
* The pass rate starts high at 200 (approximately 0.4), decreases to approximately 0.32 at 600, then drops to approximately 0.15 at 1000.
* The pass rate remains relatively stable around 0.15-0.2 between 1000 and 2200.
* The pass rate drops to approximately 0.02 at 2600, increases to approximately 0.1 at 3400, increases again to approximately 0.15 at 3800, and then drops to approximately 0.01 at 4200.
**Chart 2: Time of Creation**
* The pass rate starts at approximately 0.45 for "<2023".
* The pass rate fluctuates between approximately 0.35 and 0.55 from "2023 Q1" to "2024 Q4".
* The pass rate increases from "2025 Q1" (approximately 0.3) to "2025 Q4" (approximately 0.65).
**Chart 3: Code Complexity and Pass Rate over Time**
* **Normalized Lines (Blue):**
* Starts at approximately 0.2 for "<2023".
* Increases to approximately 0.25 at "2023 Q1", then increases sharply to approximately 0.9 at "2023 Q3".
* Peaks at 1.0 at "2023 Q4".
* Decreases to approximately 0.25 at "2024 Q2", then increases to approximately 0.7 at "2024 Q4".
* Peaks again at approximately 0.95 at "2025 Q1".
* Decreases to approximately 0.0 at "2025 Q4".
* **Normalized Pass Rate (Inverted) (Red):**
* Starts at approximately 0.55 for "<2023".
* Increases to approximately 0.65 at "2023 Q1", then increases again to approximately 0.85 at "2023 Q2".
* Decreases to approximately 0.55 at "2023 Q4".
* Decreases to approximately 0.5 at "2024 Q2", then decreases again to approximately 0.3 at "2024 Q4".
* Peaks at approximately 1.0 at "2025 Q1".
* Decreases to approximately 0.0 at "2025 Q4".
### Key Observations
* In the "Lines" chart, the pass rate generally decreases as the "Time of Creation" (represented by line count) increases.
* In the "Time of Creation" chart, the pass rate shows an upward trend in 2025 after fluctuating in previous periods.
* In the "Code Complexity and Pass Rate over Time" chart, the "Normalized Lines" and "Normalized Pass Rate (Inverted)" exhibit similar trends, with peaks and valleys occurring at roughly the same time periods.
### Interpretation
The charts suggest a complex relationship between code size ("Lines"), time of creation, code complexity, and pass rate. The initial decline in pass rate with increasing lines of code might indicate that larger codebases are initially more prone to errors. However, the "Time of Creation" chart shows that pass rates tend to improve over time, possibly due to bug fixes, refactoring, or improved testing practices. The third chart, "Code Complexity and Pass Rate over Time", indicates that the inverted pass rate and normalized lines are correlated, suggesting that as code complexity (represented by normalized lines) increases, the pass rate tends to decrease (since the pass rate is inverted). The peaks in 2023 Q3-Q4 and 2025 Q1 are notable and might correspond to specific releases or development cycles. The sharp decline in both metrics by 2025 Q4 could indicate a major shift in the codebase or testing strategy.