## Chart: Code Complexity and Pass Rate over Time
### Overview
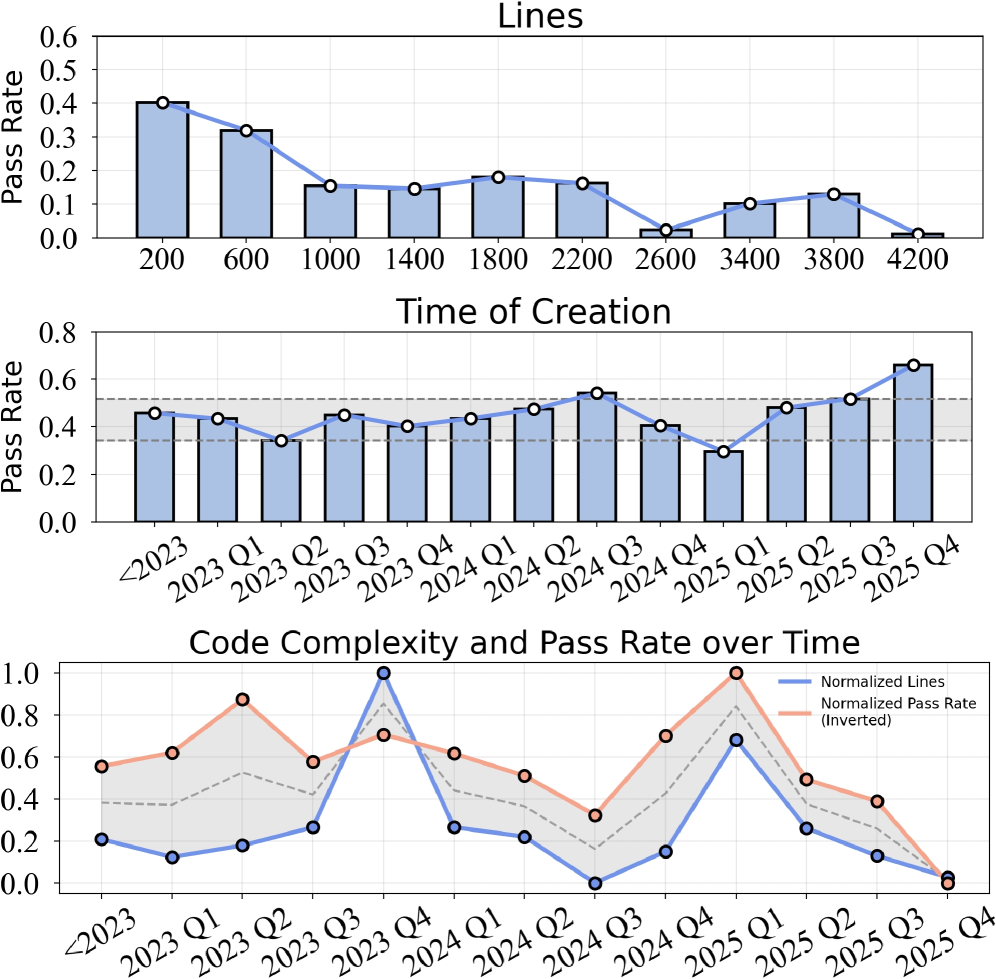
The image presents three charts visualizing the relationship between code complexity and pass rate over time. The top chart shows pass rate versus time of creation (in arbitrary units). The middle chart shows pass rate over quarterly periods from <2023 to 2025 Q4. The bottom chart displays normalized lines and normalized pass rate (inverted) over the same quarterly periods. All charts share a common theme of analyzing code quality metrics over time.
### Components/Axes
* **Top Chart:**
* X-axis: "Time of Creation" (Units are arbitrary, ranging from approximately 0 to 4200)
* Y-axis: "Pass Rate" (Scale from 0.0 to 0.6)
* Data Series: "Lines" (represented by a blue line with markers and shaded area)
* **Middle Chart:**
* X-axis: Time periods labeled as "<2023", "2023 Q1", "2023 Q2", "2023 Q3", "2023 Q4", "2024 Q1", "2024 Q2", "2024 Q3", "2024 Q4", "2025 Q1", "2025 Q2", "2025 Q3", "2025 Q4"
* Y-axis: "Pass Rate" (Scale from 0.0 to 0.8)
* Data Series: Pass Rate (represented by a blue line with markers and shaded area)
* **Bottom Chart:**
* X-axis: Same time periods as the middle chart ("<2023", "2023 Q1", etc.)
* Y-axis: Normalized values (Scale from 0.0 to 1.0)
* Data Series:
* "Normalized Lines" (represented by a blue line with circle markers)
* "Normalized Pass Rate (Inverted)" (represented by a red line with circle markers)
* Legend: Located in the top-right corner, clearly labeling the two data series.
### Detailed Analysis or Content Details
* **Top Chart ("Lines"):**
* The blue line starts at approximately (0, 0.55), decreases rapidly to around (200, 0.5), continues to decrease to approximately (600, 0.2), fluctuates between 0.1 and 0.2 until around (2600), then increases slightly to approximately (3400, 0.15), and finally decreases again to around (4200, 0.05).
* The shaded area represents the confidence interval around the line.
* **Middle Chart (Pass Rate):**
* The pass rate starts at approximately 0.35 (<2023), increases to around 0.45 (2023 Q1), decreases to approximately 0.3 (2023 Q2), increases to around 0.4 (2023 Q3), fluctuates around 0.4-0.5 through 2024, dips to approximately 0.3 (2025 Q2), and then increases to around 0.6 (2025 Q4).
* The shaded area represents the confidence interval around the line.
* **Bottom Chart (Normalized Lines & Pass Rate):**
* "Normalized Lines" (blue line): Starts at approximately 0.45 (<2023), increases to around 0.6 (2023 Q1), decreases to approximately 0.4 (2023 Q2), increases to around 0.6 (2023 Q3), fluctuates between 0.5 and 0.7 through 2024, decreases to approximately 0.4 (2025 Q2), and then increases to around 0.6 (2025 Q4).
* "Normalized Pass Rate (Inverted)" (red line): Starts at approximately 0.6 (<2023), decreases to around 0.4 (2023 Q1), increases to approximately 0.6 (2023 Q2), decreases to around 0.4 (2023 Q3), fluctuates between 0.3 and 0.5 through 2024, increases to approximately 0.6 (2025 Q2), and then decreases to around 0.4 (2025 Q4).
### Key Observations
* The top chart shows a general decreasing trend in pass rate with increasing "Time of Creation," suggesting that as code is developed over time, the pass rate tends to decline.
* The middle chart shows fluctuations in pass rate over quarterly periods, with a general upward trend towards the end of the observed period (2025 Q4).
* The bottom chart reveals an inverse relationship between normalized lines and normalized pass rate. When normalized lines increase, normalized pass rate tends to decrease, and vice versa. This suggests a trade-off between code complexity (lines) and pass rate.
* The <2023 data point in the bottom chart shows a significant difference between the two normalized values.
### Interpretation
The data suggests a complex relationship between code complexity, time, and pass rate. Initially, as code is developed ("Time of Creation" in the top chart), the pass rate declines. However, over quarterly periods (middle and bottom charts), there's a more nuanced pattern. The inverse correlation between normalized lines and pass rate indicates that increasing code complexity (more lines of code) is generally associated with a lower pass rate. The fluctuations observed in the quarterly data suggest that other factors, such as code refactoring, bug fixes, or changes in development practices, also play a role. The upward trend in pass rate towards the end of the observed period (2025 Q4) could indicate improvements in code quality control or development processes. The initial difference in the <2023 data point could be due to a smaller sample size or different initial conditions. Overall, the data highlights the importance of managing code complexity to maintain a high pass rate and ensure code quality.