TECHNICAL ASSET FINGERPRINT
419ad0ff2ff6de2ec3b81c74
Click to view fullscreen
Press ESC or click to close
FOUND IN PAPERS
EXPERT: healer-alpha-free VERSION 1
RUNTIME: free/openrouter/healer-alpha
INTEL_VERIFIED
\n
## [Chart Set]: Code Metrics and Pass Rate Analysis
### Overview
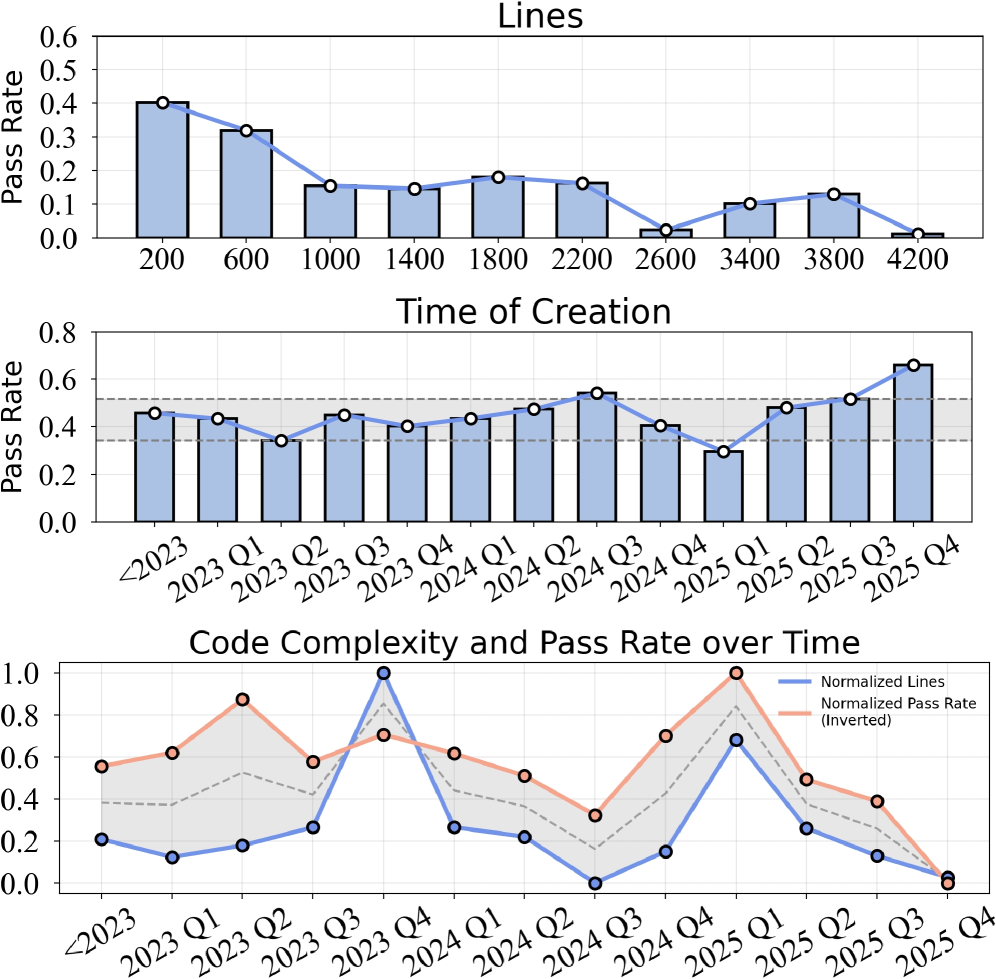
The image contains three distinct charts arranged vertically, analyzing the relationship between code characteristics (length, creation time, complexity) and a "Pass Rate" metric. The charts use a consistent visual style with light blue bars outlined in black and overlaid with line graphs. The overall theme is the analysis of code quality or test success rates relative to various attributes.
### Components/Axes
**Chart 1 (Top): "Lines"**
* **Type:** Bar chart with an overlaid line graph.
* **X-Axis:** Labeled with numerical ranges representing lines of code: `200`, `600`, `1000`, `1400`, `1800`, `2200`, `2600`, `3400`, `3800`, `4200`.
* **Y-Axis:** Labeled "Pass Rate", scaled from `0.0` to `0.6` in increments of `0.1`.
* **Data Series:**
* **Bars:** Light blue with black outline. Represent the Pass Rate for each line-count category.
* **Line:** A blue line with white circular markers, connecting the top of each bar.
**Chart 2 (Middle): "Time of Creation"**
* **Type:** Bar chart with an overlaid line graph.
* **X-Axis:** Labeled with time periods: `<2023`, `2023 Q1`, `2023 Q2`, `2023 Q3`, `2023 Q4`, `2024 Q1`, `2024 Q2`, `2024 Q3`, `2024 Q4`, `2025 Q1`, `2025 Q2`, `2025 Q3`, `2025 Q4`.
* **Y-Axis:** Labeled "Pass Rate", scaled from `0.0` to `0.8` in increments of `0.2`.
* **Data Series:**
* **Bars:** Light blue with black outline. Represent the Pass Rate for each time period.
* **Line:** A blue line with white circular markers, connecting the top of each bar.
* **Additional Element:** A horizontal dashed grey line at approximately `y=0.52`, likely indicating an average or target pass rate.
**Chart 3 (Bottom): "Code Complexity and Pass Rate over Time"**
* **Type:** Dual-line chart with a shaded area between the lines.
* **X-Axis:** Identical to Chart 2: `<2023` through `2025 Q4`.
* **Y-Axis:** Unlabeled, but scaled from `0.0` to `1.0` in increments of `0.2`. Represents normalized values.
* **Legend (Top-Right):**
* **Blue Line:** "Normalized Lines"
* **Orange Line:** "Normalized Pass Rate (Inverted)"
* **Data Series:**
* **Blue Line ("Normalized Lines"):** Connects blue circular markers. Shows the trend of normalized code length over time.
* **Orange Line ("Normalized Pass Rate (Inverted)"):** Connects orange circular markers. Shows the trend of an inverted and normalized pass rate over time.
* **Shaded Area:** A light grey fill between the two lines, highlighting the divergence/convergence of the metrics.
### Detailed Analysis
**Chart 1: Lines vs. Pass Rate**
* **Trend:** The pass rate shows a clear **downward trend** as the number of lines increases. The highest pass rate is for the shortest code.
* **Data Points (Approximate from bar heights):**
* 200 lines: ~0.40
* 600 lines: ~0.32
* 1000 lines: ~0.15
* 1400 lines: ~0.14
* 1800 lines: ~0.18
* 2200 lines: ~0.16
* 2600 lines: ~0.02 (sharp drop)
* 3400 lines: ~0.10
* 3800 lines: ~0.13
* 4200 lines: ~0.01
**Chart 2: Time of Creation vs. Pass Rate**
* **Trend:** The pass rate fluctuates but shows a general **upward trend** from 2023 to late 2025, with a notable dip in 2024 Q4.
* **Data Points (Approximate from bar heights):**
* <2023: ~0.45
* 2023 Q1: ~0.43
* 2023 Q2: ~0.34
* 2023 Q3: ~0.45
* 2023 Q4: ~0.40
* 2024 Q1: ~0.43
* 2024 Q2: ~0.48
* 2024 Q3: ~0.54
* 2024 Q4: ~0.40
* 2025 Q1: ~0.30 (lowest point)
* 2025 Q2: ~0.48
* 2025 Q3: ~0.52
* 2025 Q4: ~0.65 (highest point)
**Chart 3: Normalized Complexity & Pass Rate over Time**
* **Trend - Normalized Lines (Blue):** Highly volatile. Peaks sharply in `2023 Q4` (~1.0) and `2025 Q1` (~0.7). Troughs in `2024 Q3` (~0.0) and `2025 Q4` (~0.0).
* **Trend - Normalized Pass Rate (Inverted) (Orange):** Also volatile, but often moves in the **opposite direction** to the blue line. Peaks in `2023 Q2` (~0.88) and `2025 Q1` (~1.0). Troughs in `2024 Q3` (~0.32) and `2025 Q4` (~0.0).
* **Relationship:** The two lines show a strong **inverse correlation**. When normalized lines (complexity) increase, the inverted pass rate tends to decrease (meaning the actual pass rate increases), and vice-versa. This is visually emphasized by the shaded area, which is widest when the metrics diverge most (e.g., `2023 Q4`, `2025 Q1`).
### Key Observations
1. **Code Length Penalty:** There is a strong negative correlation between code length and pass rate. Shorter code snippets have a significantly higher chance of passing.
2. **Temporal Improvement:** Code created in more recent quarters (especially late 2025) tends to have a higher pass rate, suggesting improvements in code quality, tooling, or testing over time.
3. **Complexity-Pass Rate Inversion:** The third chart reveals a nuanced relationship. The "Normalized Pass Rate" is plotted as *inverted*. Therefore, when the orange line is high, the *actual* pass rate is low. The inverse correlation suggests that periods of higher normalized code length (complexity) are associated with lower actual pass rates.
4. **Volatility in 2024-2025:** Both time-based charts show significant volatility in 2024 Q4 and 2025 Q1, with sharp dips and recoveries, indicating a period of instability or change in the codebase or evaluation process.
### Interpretation
This set of charts provides a multi-faceted view of code quality metrics. The primary takeaway is that **simplicity and recency are strong predictors of success** ("Pass Rate").
* **The "Lines" chart** is a classic demonstration of the software engineering principle that smaller, more focused code units are less error-prone and easier to validate. The dramatic drop-off after 2200 lines suggests a potential threshold where complexity becomes unmanageable.
* **The "Time of Creation" chart** acts as a proxy for process maturity. The general upward trend implies that the development team, their practices, or the automated systems have improved over the observed period (2023-2025). The dip in 2024 Q4 could indicate a rushed release, a change in requirements, or the introduction of new, initially buggy features.
* **The "Code Complexity and Pass Rate over Time" chart** is the most insightful. By normalizing and inverting the pass rate, it directly contrasts complexity with success. The inverse correlation confirms that as code becomes more complex (longer), its likelihood of passing decreases. The shaded area visually represents the "quality gap" – the divergence between complexity and success. The convergence of both lines to zero in 2025 Q4 is particularly striking, suggesting a period where both code length and pass rate were exceptionally low, which could indicate a major refactor, a shift to microservices, or a change in what is being measured.
**In summary, the data argues for maintaining short, simple code modules and highlights the positive impact of evolving development practices over time. The volatility in late 2024/early 2025 warrants investigation into specific events during that period.**
DECODING INTELLIGENCE...