## Line Charts: Pass Rate Trends and Code Complexity Analysis
### Overview
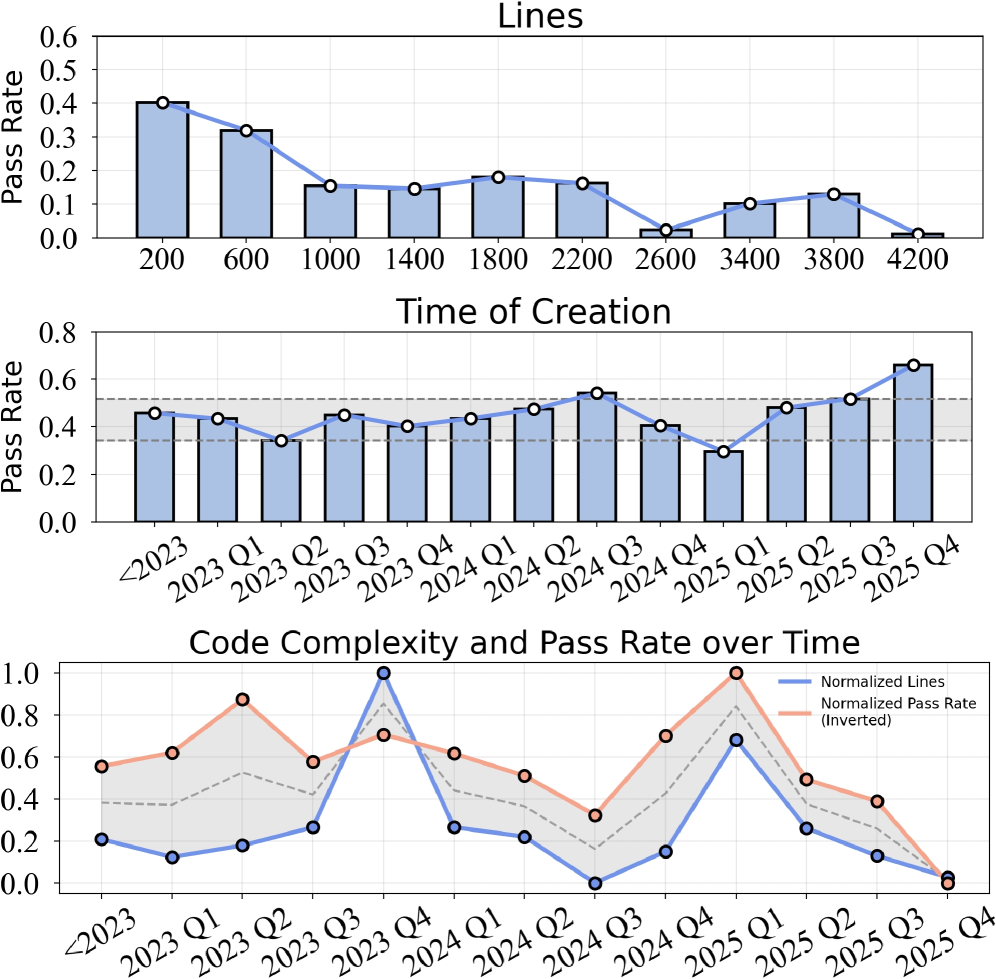
The image contains three vertically stacked line/bar charts analyzing pass rates, time of creation, and code complexity over time. The charts use blue and red color coding with legends for data series identification. Key trends include declining pass rates, cyclical fluctuations, and inverse relationships between complexity and pass rates.
### Components/Axes
1. **Top Chart (Lines)**
- **X-axis**: Numerical values (200, 600, 1000, 1400, 1800, 2200, 2600, 3400, 3800, 4200)
- **Y-axis**: Pass Rate (0.0 to 0.6)
- **Legend**: "Normalized Lines" (blue line with circles)
- **Trend**: Steady decline from ~0.4 to near 0.0
2. **Middle Chart (Time of Creation)**
- **X-axis**: Time periods (2023 Q1–Q4, 2024 Q1–Q4, 2025 Q1–Q4)
- **Y-axis**: Pass Rate (0.0 to 0.8)
- **Legend**: "Normalized Pass Rate (Inverted)" (blue bars with dashed threshold line at 0.4)
- **Trend**: Fluctuations around 0.4 with peaks in 2024 Q2 and 2025 Q4
3. **Bottom Chart (Code Complexity and Pass Rate)**
- **X-axis**: Time periods (2023 Q1–Q4, 2024 Q1–Q4, 2025 Q1–Q4)
- **Y-axis**: Dual scale (0.0 to 1.0 for both metrics)
- **Legend**:
- Blue line: "Normalized Lines"
- Red line: "Normalized Pass Rate (Inverted)"
- **Trend**: Inverse correlation between blue (complexity) and red (pass rate) lines
### Detailed Analysis
1. **Top Chart (Lines)**
- Data points:
- 200: 0.4
- 600: 0.3
- 1000: 0.15
- 1400: 0.15
- 1800: 0.18
- 2200: 0.15
- 2600: 0.02
- 3400: 0.08
- 3800: 0.12
- 4200: 0.01
- Spatial grounding: Blue line with circular markers dominates the upper half of the chart.
2. **Middle Chart (Time of Creation)**
- Data points:
- 2023 Q1: 0.45
- 2023 Q2: 0.38
- 2023 Q3: 0.45
- 2023 Q4: 0.42
- 2024 Q1: 0.45
- 2024 Q2: 0.52
- 2024 Q3: 0.40
- 2024 Q4: 0.35
- 2025 Q1: 0.48
- 2025 Q2: 0.50
- 2025 Q3: 0.55
- 2025 Q4: 0.65
- Spatial grounding: Blue bars occupy the lower half, with dashed threshold line at 0.4.
3. **Bottom Chart (Code Complexity and Pass Rate)**
- Data points:
- **Blue line (Complexity)**:
- 2023 Q1: 0.2
- 2023 Q2: 0.15
- 2023 Q3: 0.3
- 2023 Q4: 1.0
- 2024 Q1: 0.25
- 2024 Q2: 0.05
- 2024 Q3: 0.0
- 2024 Q4: 0.2
- 2025 Q1: 0.6
- 2025 Q2: 0.25
- 2025 Q3: 0.1
- 2025 Q4: 0.0
- **Red line (Pass Rate)**:
- 2023 Q1: 0.55
- 2023 Q2: 0.62
- 2023 Q3: 0.58
- 2023 Q4: 0.65
- 2024 Q1: 0.50
- 2024 Q2: 0.35
- 2024 Q3: 0.8
- 2024 Q4: 0.45
- 2025 Q1: 0.7
- 2025 Q2: 0.55
- 2025 Q3: 0.4
- 2025 Q4: 0.0
- Spatial grounding: Overlapping lines with shaded confidence intervals.
### Key Observations
1. **Declining Pass Rates**: The top chart shows a consistent drop in pass rates from 0.4 to near 0.0 over increasing numerical values.
2. **Cyclical Fluctuations**: The middle chart reveals quarterly pass rate oscillations, with significant dips in 2024 Q4 and 2025 Q1.
3. **Inverse Relationship**: The bottom chart demonstrates a strong inverse correlation between code complexity (blue) and pass rates (red), with peaks in complexity coinciding with pass rate troughs.
4. **Threshold Breaches**: The middle chart's dashed line at 0.4 acts as a performance benchmark, with only 2025 Q4 exceeding it.
### Interpretation
The data suggests a deteriorating system performance over time, with pass rates declining as code complexity increases. The inverse relationship in the bottom chart implies that higher complexity correlates with lower pass rates, potentially indicating technical debt accumulation. The cyclical patterns in the middle chart may reflect seasonal testing phases or iterative development cycles. The 2025 Q4 outlier (pass rate 0.65) warrants investigation, as it contradicts the overall downward trend. The threshold line at 0.4 in the middle chart highlights a critical performance boundary that most quarters fail to maintain.