## Bar Chart: Accuracy on Image Size Intervals
### Overview
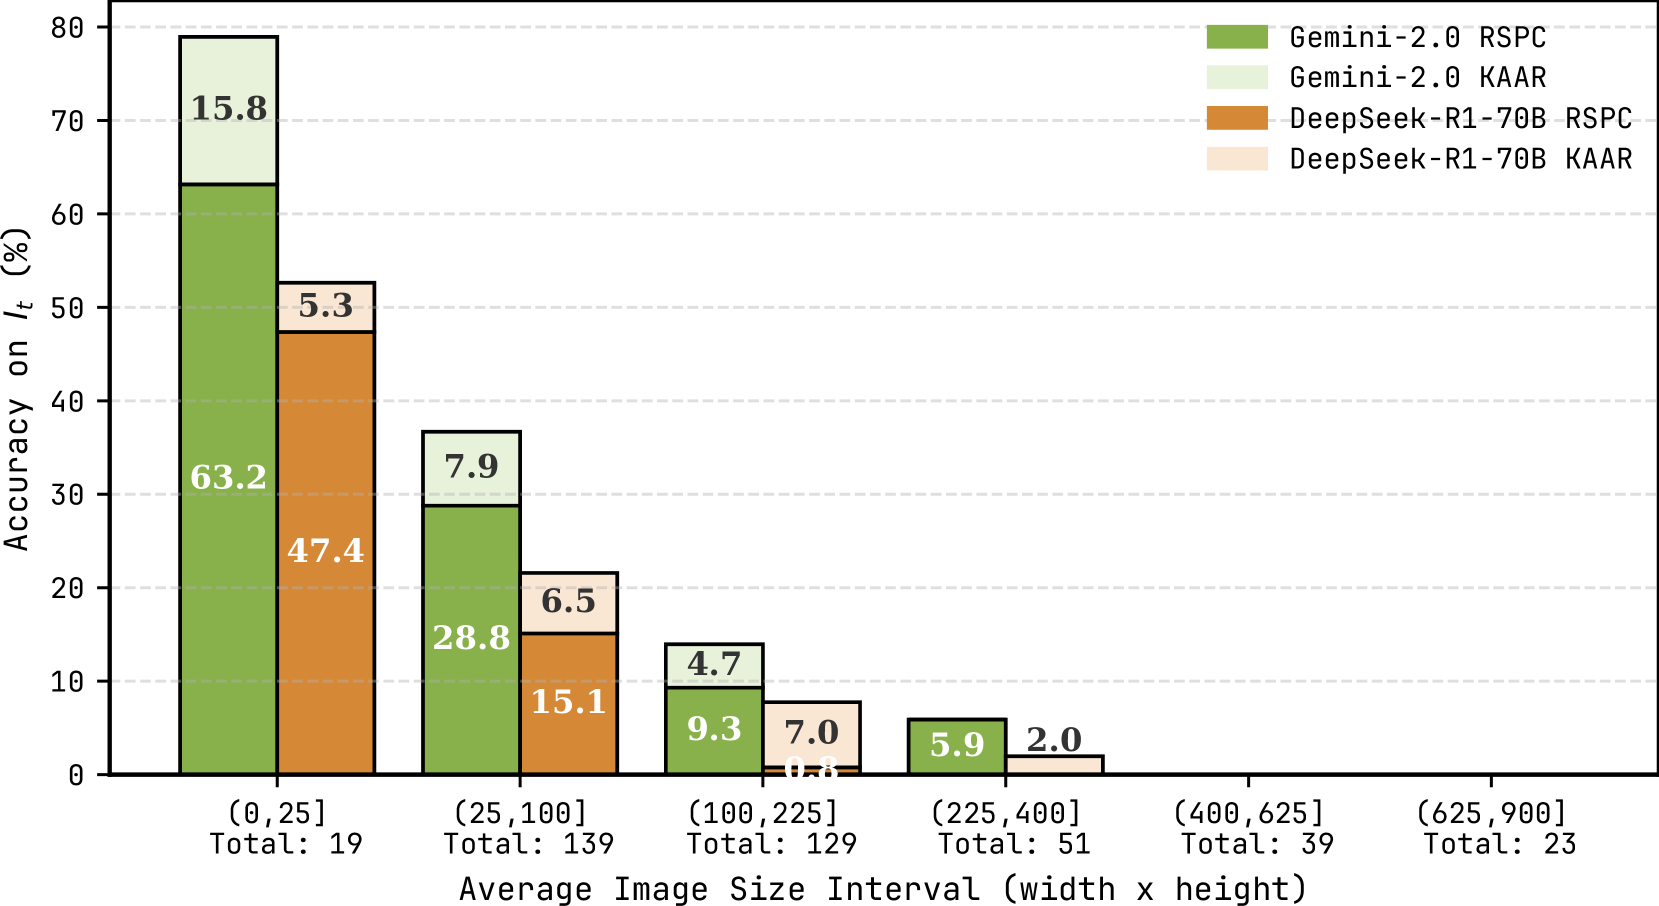
The image is a bar chart comparing the accuracy of two models, Gemini-2.0 and DeepSeek-R1-70B, on images of varying sizes. The accuracy is measured on two different tasks, RSPC and KAAR. The x-axis represents the average image size interval (width x height), and the y-axis represents the accuracy on It (%).
### Components/Axes
* **Y-axis:** "Accuracy on It (%)", ranging from 0 to 80, with tick marks at intervals of 10.
* **X-axis:** "Average Image Size Interval (width x height)". The categories are:
* (0,25] Total: 19
* (25,100] Total: 139
* (100,225] Total: 129
* (225,400] Total: 51
* (400,625] Total: 39
* (625,900] Total: 23
* **Legend:** Located at the top-right of the chart.
* Green: Gemini-2.0 RSPC
* Light Green: Gemini-2.0 KAAR
* Orange: DeepSeek-R1-70B RSPC
* Light Orange: DeepSeek-R1-70B KAAR
### Detailed Analysis
The chart displays the accuracy of each model on each image size interval. The bars are stacked, with the RSPC accuracy shown as the base and the KAAR accuracy stacked on top.
* **(0,25] Total: 19**
* Gemini-2.0 RSPC: 63.2
* Gemini-2.0 KAAR: 15.8
* DeepSeek-R1-70B RSPC: 47.4
* DeepSeek-R1-70B KAAR: 5.3
* **(25,100] Total: 139**
* Gemini-2.0 RSPC: 28.8
* Gemini-2.0 KAAR: 7.9
* DeepSeek-R1-70B RSPC: 15.1
* DeepSeek-R1-70B KAAR: 6.5
* **(100,225] Total: 129**
* Gemini-2.0 RSPC: 9.3
* Gemini-2.0 KAAR: 4.7
* DeepSeek-R1-70B RSPC: 1.8
* DeepSeek-R1-70B KAAR: 7.0
* **(225,400] Total: 51**
* Gemini-2.0 RSPC: 5.9
* Gemini-2.0 KAAR: Not visible, assumed to be 0
* DeepSeek-R1-70B RSPC: Not visible, assumed to be 0
* DeepSeek-R1-70B KAAR: 2.0
* **(400,625] Total: 39**
* Gemini-2.0 RSPC: Not visible, assumed to be 0
* Gemini-2.0 KAAR: Not visible, assumed to be 0
* DeepSeek-R1-70B RSPC: Not visible, assumed to be 0
* DeepSeek-R1-70B KAAR: Not visible, assumed to be 0
* **(625,900] Total: 23**
* Gemini-2.0 RSPC: Not visible, assumed to be 0
* Gemini-2.0 KAAR: Not visible, assumed to be 0
* DeepSeek-R1-70B RSPC: Not visible, assumed to be 0
* DeepSeek-R1-70B KAAR: Not visible, assumed to be 0
### Key Observations
* Gemini-2.0 performs significantly better than DeepSeek-R1-70B on smaller images (0,25] and (25,100].
* The accuracy of both models decreases as the image size increases.
* For larger image sizes, the accuracy of both models is very low, approaching zero.
* The "Total" values below each interval indicate the number of images in that size range.
### Interpretation
The chart suggests that Gemini-2.0 is better suited for processing smaller images, while both models struggle with larger images. The decreasing accuracy with increasing image size could be due to factors such as increased computational complexity, memory limitations, or the presence of more noise or irrelevant information in larger images. The performance difference between RSPC and KAAR tasks is also notable, with RSPC generally showing higher accuracy. The number of images in each size interval varies, which could also influence the overall accuracy observed for each interval.