## Diagram: Grid with Values and Arrows
### Overview
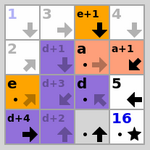
The image is a 4x4 grid diagram containing numbers, letters, and directional arrows. The grid cells are colored in shades of white, light gray, orange, and purple. Each cell contains a combination of text and arrows, indicating values and directions.
### Components/Axes
* **Grid:** A 4x4 matrix representing the diagram's structure.
* **Cells:** Individual squares within the grid, each containing data.
* **Values:** Letters and numbers within the cells (e.g., "1", "e+1", "a", "d+4").
* **Arrows:** Directional indicators within the cells, pointing up, down, left, right, or diagonally.
* **Colors:** White, light gray, orange, and purple, used to differentiate cells.
### Detailed Analysis
Here's a breakdown of the grid's content, row by row:
* **Row 1:**
* Cell 1 (Top-Left): "1" (blue), downward gray arrow.
* Cell 2: "3", rightward gray arrow.
* Cell 3: "e+1" (orange), downward black arrow.
* Cell 4: "4", downward-right gray arrow.
* **Row 2:**
* Cell 1: "2", rightward gray arrow.
* Cell 2: "d+1" (purple), downward gray arrow.
* Cell 3: "a" (orange), rightward brown arrow, dot below "a".
* Cell 4: "a+1" (light orange), downward-left black arrow.
* **Row 3:**
* Cell 1: "e" (orange), rightward brown arrow, dot below "e".
* Cell 2: "d+3" (purple), downward gray arrow.
* Cell 3: "d" (purple), dot below "d".
* Cell 4: "5", leftward black arrow.
* **Row 4:**
* Cell 1: "d+4" (purple), rightward black arrow.
* Cell 2: "d+2" (purple), upward gray arrow.
* Cell 3: Light gray, upward black arrow, dot below arrow.
* Cell 4: "16" (blue), star symbol.
### Key Observations
* The grid uses a combination of numerical and alphabetical values, often with additions (e.g., "e+1", "d+1").
* Directional arrows indicate movement or flow within the grid.
* Cell colors may represent different categories or states.
* The bottom-right cell contains a numerical value ("16") and a star symbol.
### Interpretation
The diagram appears to represent a game board, puzzle, or a system with interconnected elements. The values and arrows likely indicate rules, states, or transitions within the system. The colors could represent different types of cells or conditions. The star symbol in the bottom-right cell might indicate a goal or completion point. The "d" and "e" values could be variables that change based on the arrows.