## Line Chart: Accuracy vs. Thinking Compute
### Overview
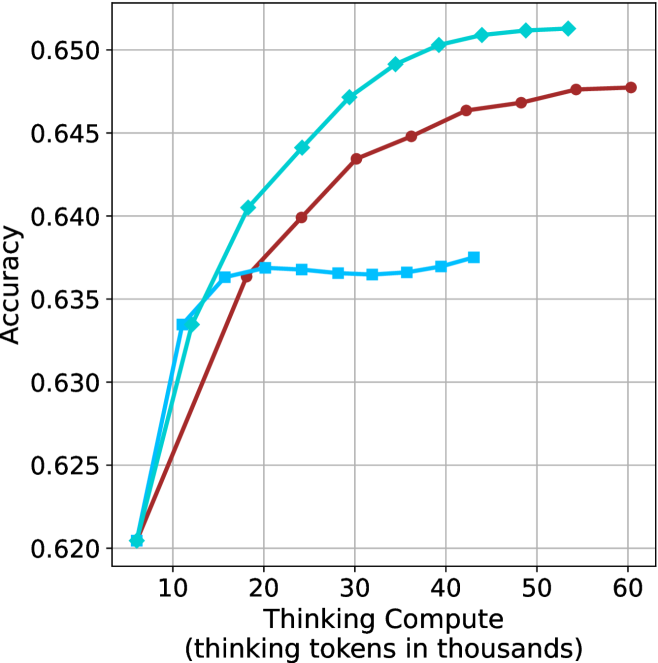
The image presents a line chart illustrating the relationship between "Thinking Compute" (measured in thousands of tokens) and "Accuracy". Three distinct data series are plotted, each represented by a different colored line. The chart appears to demonstrate how accuracy improves with increased computational effort (thinking tokens).
### Components/Axes
* **X-axis:** "Thinking Compute (thinking tokens in thousands)". The scale ranges from approximately 5 to 60, with markers at 10, 20, 30, 40, 50, and 60.
* **Y-axis:** "Accuracy". The scale ranges from approximately 0.620 to 0.650, with markers at 0.620, 0.625, 0.630, 0.635, 0.640, 0.645, and 0.650.
* **Data Series:** Three lines are present, each with a unique color:
* Light Blue
* Red
* Dark Blue
### Detailed Analysis
* **Light Blue Line:** This line starts at approximately (5, 0.621) and exhibits a steep upward trend until around (30, 0.648). After 30, the slope decreases, and the line plateaus around (60, 0.649).
* (5, 0.621)
* (10, 0.634)
* (20, 0.642)
* (30, 0.648)
* (40, 0.649)
* (50, 0.649)
* (60, 0.649)
* **Red Line:** This line begins at approximately (5, 0.623) and shows a consistent upward trend, though less steep than the light blue line. It reaches a peak around (40, 0.649) and then slightly decreases to approximately (60, 0.647).
* (5, 0.623)
* (10, 0.635)
* (20, 0.643)
* (30, 0.646)
* (40, 0.649)
* (50, 0.648)
* (60, 0.647)
* **Dark Blue Line:** This line starts at approximately (5, 0.625) and initially rises, but its growth slows significantly after (20, 0.637). It plateaus around (60, 0.637).
* (5, 0.625)
* (10, 0.632)
* (20, 0.637)
* (30, 0.637)
* (40, 0.637)
* (50, 0.637)
* (60, 0.637)
### Key Observations
* The light blue line consistently demonstrates the highest accuracy across all "Thinking Compute" values.
* The dark blue line shows the least improvement in accuracy with increasing "Thinking Compute".
* All three lines exhibit diminishing returns in accuracy as "Thinking Compute" increases beyond 30 thousand tokens.
* The red line shows a steady increase in accuracy, but remains below the light blue line.
### Interpretation
The chart suggests that increasing the amount of "Thinking Compute" (as measured by tokens) generally improves accuracy, but there are diminishing returns. The light blue line likely represents a model or approach that benefits most significantly from increased computational resources. The dark blue line suggests a model or approach that is less sensitive to increased "Thinking Compute", potentially due to inherent limitations or a different underlying mechanism. The red line represents an intermediate case.
The plateauing of all lines indicates that there is a point beyond which additional computational effort does not yield substantial gains in accuracy. This could be due to factors such as data limitations, model capacity, or the inherent complexity of the task. The differences between the lines could be due to different algorithms, model architectures, or training data. Further investigation would be needed to determine the specific reasons for these variations.