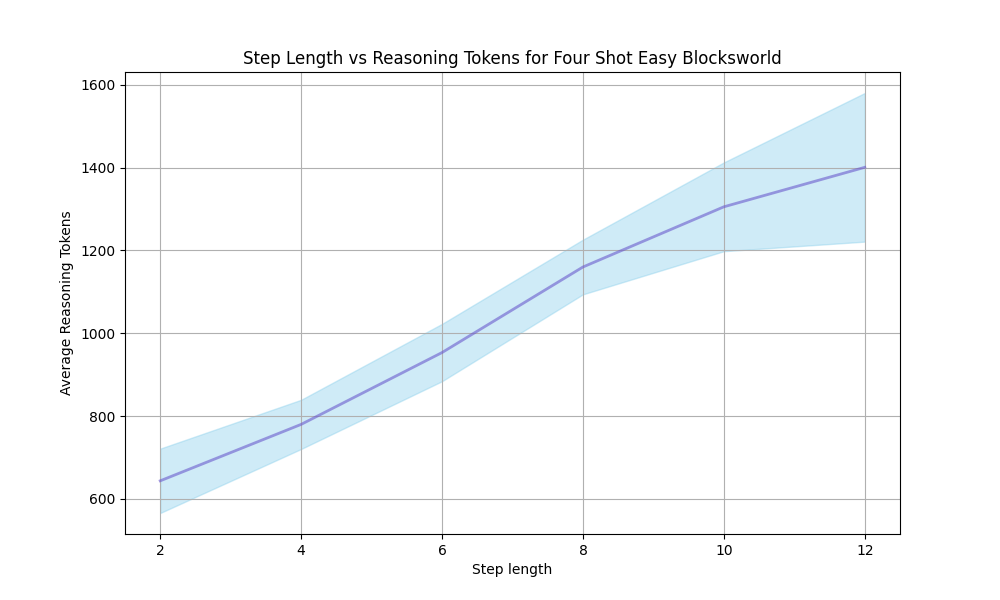
## Line Chart: Step Length vs Reasoning Tokens for Four Shot Easy Blocksworld
### Overview
The image is a line chart that plots the relationship between "Step Length" and "Average Reasoning Tokens" for a "Four Shot Easy Blocksworld" scenario. The chart displays a generally positive correlation, with an upward trend in reasoning tokens as step length increases. A shaded region around the line indicates variability or uncertainty.
### Components/Axes
* **Title:** "Step Length vs Reasoning Tokens for Four Shot Easy Blocksworld"
* **X-axis:** "Step length" with markers at 2, 4, 6, 8, 10, and 12.
* **Y-axis:** "Average Reasoning Tokens" with markers at 600, 800, 1000, 1200, 1400, and 1600.
* **Data Series:** A single line representing the average reasoning tokens. The line is a dark blue-purple color. A light blue shaded region surrounds the line, indicating a confidence interval or standard deviation.
### Detailed Analysis
* **X-Axis (Step Length):** Ranges from 2 to 12 in increments of 2.
* **Y-Axis (Average Reasoning Tokens):** Ranges from 600 to 1600 in increments of 200.
* **Data Series Trend:** The dark blue-purple line shows a generally increasing trend. As step length increases, the average reasoning tokens also increase.
* At step length 2, the average reasoning tokens are approximately 650.
* At step length 4, the average reasoning tokens are approximately 800.
* At step length 6, the average reasoning tokens are approximately 975.
* At step length 8, the average reasoning tokens are approximately 1175.
* At step length 10, the average reasoning tokens are approximately 1300.
* At step length 12, the average reasoning tokens are approximately 1400.
* **Shaded Region:** The light blue shaded region around the line represents the variability or uncertainty in the average reasoning tokens. The width of the shaded region appears to increase as the step length increases, suggesting greater variability at higher step lengths.
* At step length 2, the shaded region spans from approximately 575 to 725.
* At step length 12, the shaded region spans from approximately 1225 to 1575.
### Key Observations
* There is a clear positive correlation between step length and average reasoning tokens.
* The variability in reasoning tokens appears to increase with step length.
* The rate of increase in reasoning tokens seems to slow down slightly at higher step lengths (10 and 12).
### Interpretation
The chart suggests that as the step length increases in the "Four Shot Easy Blocksworld" scenario, the average reasoning tokens required also increase. This could indicate that longer step lengths require more complex reasoning or more tokens to represent the reasoning process. The increasing variability at higher step lengths might suggest that the complexity of reasoning varies more significantly for longer steps. The slight slowdown in the rate of increase at higher step lengths could indicate a diminishing return or a plateau effect, where the reasoning complexity doesn't increase linearly with step length beyond a certain point.