\n
## Line Chart: Step Length vs Reasoning Tokens for Four Shot Easy Blocksworld
### Overview
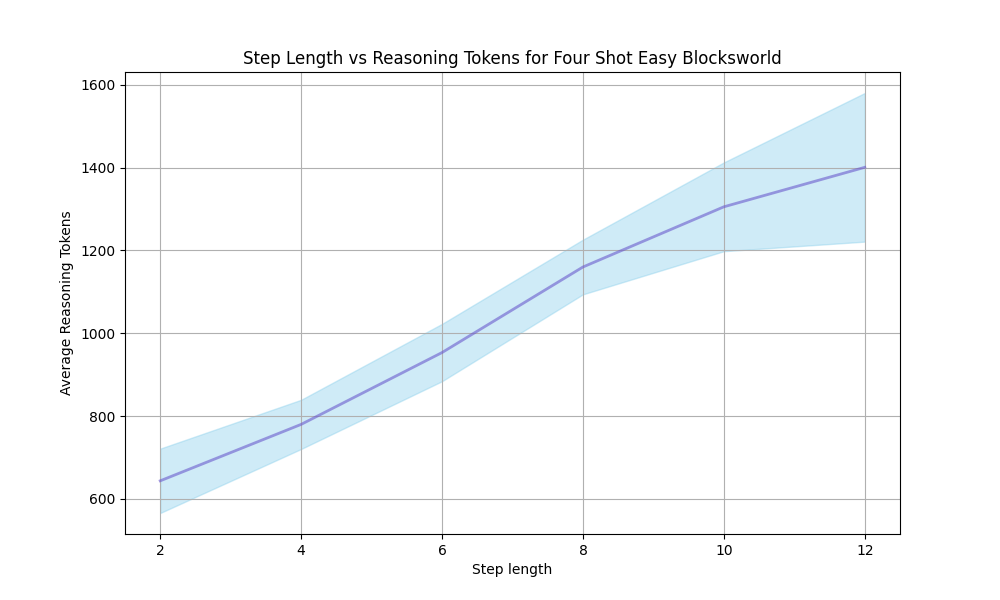
This chart depicts the relationship between step length and the average number of reasoning tokens used in a "Four Shot Easy Blocksworld" environment. The chart uses a line graph with a shaded area representing the variance or confidence interval around the mean.
### Components/Axes
* **Title:** "Step Length vs Reasoning Tokens for Four Shot Easy Blocksworld" - positioned at the top-center of the chart.
* **X-axis:** "Step length" - ranging from approximately 2 to 12, with tick marks at integer values.
* **Y-axis:** "Average Reasoning Tokens" - ranging from approximately 600 to 1600, with tick marks at intervals of 200.
* **Data Series:** A single blue line representing the average reasoning tokens, with a light blue shaded area indicating the standard deviation or confidence interval.
* **Grid:** A light gray grid is present, aiding in the readability of the data points.
### Detailed Analysis
The blue line representing the average reasoning tokens exhibits a generally upward trend. As the step length increases, the average number of reasoning tokens also increases. The shaded area around the line indicates the variability in the data.
Here's an approximate extraction of data points, noting the inherent uncertainty in reading values from the chart:
* **Step Length = 2:** Average Reasoning Tokens ≈ 700
* **Step Length = 4:** Average Reasoning Tokens ≈ 850
* **Step Length = 6:** Average Reasoning Tokens ≈ 1000
* **Step Length = 8:** Average Reasoning Tokens ≈ 1150
* **Step Length = 10:** Average Reasoning Tokens ≈ 1350
* **Step Length = 12:** Average Reasoning Tokens ≈ 1550
The shaded area's width varies along the x-axis. It appears wider at lower step lengths (2-6) indicating greater variance in reasoning tokens at those points, and narrows as step length increases (8-12), suggesting more consistent reasoning token usage.
### Key Observations
* The relationship between step length and reasoning tokens is positive and appears roughly linear.
* The variance in reasoning token usage is higher at lower step lengths.
* There are no obvious outliers or anomalies in the data.
### Interpretation
The chart suggests that as the complexity of the task (represented by step length) increases, the model requires more reasoning tokens to solve it. This is a logical expectation, as more steps generally necessitate more complex thought processes. The decreasing variance at higher step lengths could indicate that the model becomes more consistent in its reasoning approach as the task becomes more challenging, or that the variance is simply being masked by the increasing average. The "Four Shot Easy Blocksworld" context suggests this is a relatively simple environment, and the linear relationship may not hold true for more complex scenarios. The data implies a direct correlation between the number of steps required to solve a problem and the computational resources (reasoning tokens) needed. This information is valuable for understanding the scalability and efficiency of the model in this specific environment.