\n
## Bar Chart: Shifter - Time vs Core count
### Overview
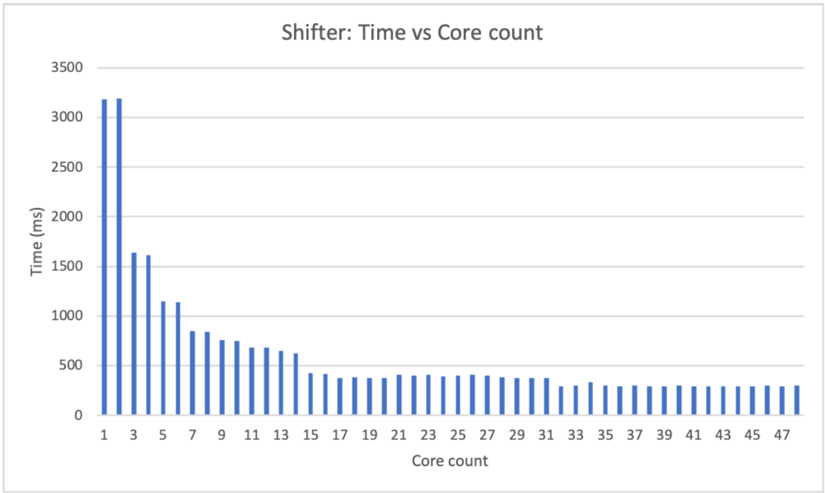
The image presents a bar chart illustrating the relationship between core count and execution time (in milliseconds) for a process labeled "Shifter". The chart displays a decreasing trend, indicating that as the number of cores increases, the execution time generally decreases, but with diminishing returns.
### Components/Axes
* **Title:** "Shifter: Time vs Core count" - positioned at the top-center of the chart.
* **X-axis:** "Core count" - ranging from 1 to 47, with increments of 2.
* **Y-axis:** "Time (ms)" - ranging from 0 to 3500, with increments of 500.
* **Data Series:** A single series of blue bars representing the execution time for each core count.
### Detailed Analysis
The chart shows a steep decline in execution time from 1 to 7 cores. After 7 cores, the decrease in execution time becomes less pronounced, leveling off around 200-300ms for core counts between 19 and 47.
Here's a breakdown of approximate values, reading from the chart:
* **1 Core:** ~3100 ms
* **3 Cores:** ~1500 ms
* **5 Cores:** ~900 ms
* **7 Cores:** ~650 ms
* **9 Cores:** ~550 ms
* **11 Cores:** ~450 ms
* **13 Cores:** ~380 ms
* **15 Cores:** ~330 ms
* **17 Cores:** ~290 ms
* **19 Cores:** ~260 ms
* **21 Cores:** ~240 ms
* **23 Cores:** ~230 ms
* **25 Cores:** ~220 ms
* **27 Cores:** ~210 ms
* **29 Cores:** ~200 ms
* **31 Cores:** ~190 ms
* **33 Cores:** ~180 ms
* **35 Cores:** ~170 ms
* **37 Cores:** ~160 ms
* **39 Cores:** ~150 ms
* **41 Cores:** ~140 ms
* **43 Cores:** ~130 ms
* **45 Cores:** ~120 ms
* **47 Cores:** ~110 ms
The bars are consistently blue, indicating a single data series.
### Key Observations
* The most significant performance gains are achieved with a relatively small number of cores (1-7).
* Adding more than 7 cores yields diminishing returns in terms of execution time reduction.
* The execution time appears to converge towards a minimum value around 110-120ms as the core count increases beyond 40.
### Interpretation
The data suggests that the "Shifter" process is well-suited for parallelization, as increasing the number of cores initially leads to substantial performance improvements. However, the process likely reaches a point of diminishing returns due to factors such as overhead associated with core communication or inherent sequential components within the algorithm. The leveling off of the curve indicates that beyond a certain core count, the benefits of parallelization are outweighed by these overheads. This information is valuable for optimizing resource allocation when running the "Shifter" process, as investing in more than approximately 7-10 cores may not yield a proportional improvement in performance. The chart implies that the process is likely CPU-bound, as increasing the number of cores directly impacts execution time.