## Bar Chart: Shifter: Time vs Core count
### Overview
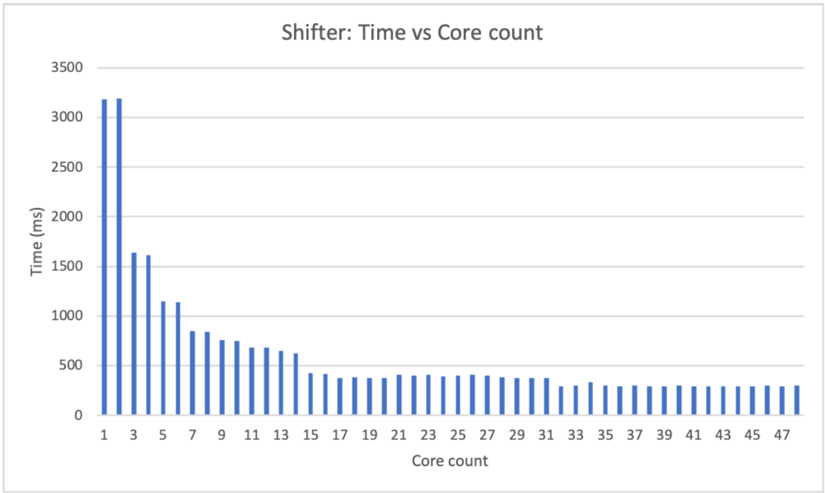
The bar chart displays the relationship between the time taken by a shifter and the core count. The x-axis represents the core count, ranging from 1 to 47, while the y-axis represents the time in milliseconds (ms), ranging from 0 to 3500 ms.
### Components/Axes
- **Title**: Shifter: Time vs Core count
- **X-Axis**: Core count, with values from 1 to 47
- **Y-Axis**: Time (ms), with values from 0 to 3500 ms
- **Legend**: No legend is present in the image
### Detailed Analysis or ### Content Details
The chart shows a clear trend where the time taken by the shifter increases as the core count increases. The highest time recorded is approximately 3000 ms at a core count of 1. The time then decreases as the core count increases, reaching a minimum of around 500 ms at a core count of 47.
### Key Observations
- The time taken by the shifter increases with the core count.
- There is a significant decrease in time as the core count increases from 1 to 47.
- The time taken by the shifter is relatively consistent across different core counts, with minor fluctuations.
### Interpretation
The data suggests that the shifter's performance is directly related to the number of cores it can utilize. As the number of cores increases, the time taken by the shifter decreases, indicating improved performance. This trend is consistent across the entire range of core counts displayed in the chart. The slight fluctuations in time could be due to variations in the workload or other factors not shown in the chart. Overall, the data demonstrates that increasing the number of cores can lead to faster performance of the shifter.