## Heatmap: Layer vs. Token
### Overview
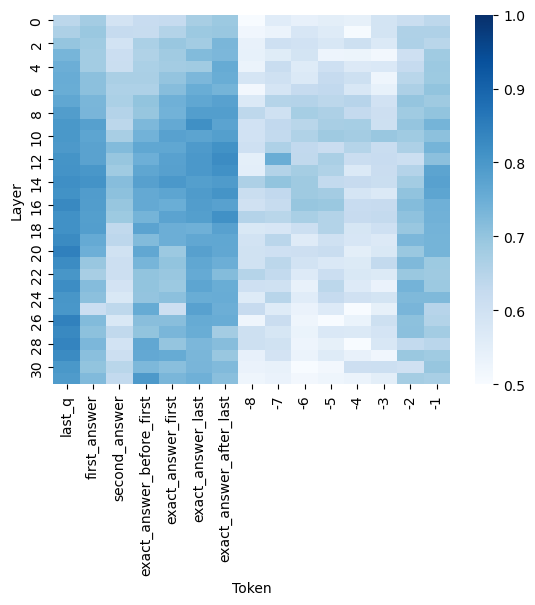
The image is a heatmap visualizing the relationship between "Layer" and "Token". The color intensity represents a value, ranging from 0.5 (lightest blue) to 1.0 (darkest blue), as indicated by the colorbar on the right. The x-axis represents different tokens, and the y-axis represents layers.
### Components/Axes
* **X-axis (Token):**
* last\_q
* first\_answer
* second\_answer
* exact\_answer\_before\_first
* exact\_answer\_first
* exact\_answer\_last
* exact\_answer\_after\_last
* -8
* -7
* -6
* -5
* -4
* -3
* -2
* -1
* **Y-axis (Layer):** 0, 2, 4, 6, 8, 10, 12, 14, 16, 18, 20, 22, 24, 26, 28, 30
* **Colorbar:** Ranges from 0.5 to 1.0, with intermediate values of 0.6, 0.7, 0.8, and 0.9.
### Detailed Analysis
The heatmap displays varying color intensities, indicating different values for each layer-token combination.
* **Tokens "last\_q", "first\_answer", "second\_answer", "exact\_answer\_before\_first", "exact\_answer\_first", "exact\_answer\_last", and "exact\_answer\_after\_last":** These tokens generally show higher values (darker blue) across all layers, with values generally between 0.7 and 1.0.
* **Tokens "-8" to "-1":** These tokens generally show lower values (lighter blue) across all layers, with values generally between 0.5 and 0.8.
* **Layer 0-10:** The values for tokens "-8" to "-1" are generally higher (darker blue) compared to layers 20-30.
* **Layer 12:** The value for "exact_answer_first" is notably lower (lighter blue) compared to other layers.
### Key Observations
* The first seven tokens ("last\_q" to "exact\_answer\_after\_last") consistently exhibit higher values across all layers compared to the remaining tokens ("-8" to "-1").
* The values for tokens "-8" to "-1" tend to be lower, especially in the lower layers (20-30).
* There is some variation in values across different layers for the same token, but the general trend remains consistent.
### Interpretation
The heatmap suggests that the first seven tokens ("last\_q" to "exact\_answer\_after\_last") are more significant or have a stronger relationship with the layers compared to the remaining tokens ("-8" to "-1"). The lower values for tokens "-8" to "-1" might indicate a weaker association or less relevance to the layers being analyzed. The variation across layers could reflect the hierarchical processing or feature extraction occurring within the layers. The outlier at Layer 12 for "exact_answer_first" might indicate a specific interaction or anomaly at that layer for that particular token.