## Sequence-to-Sequence Model Diagram
### Overview
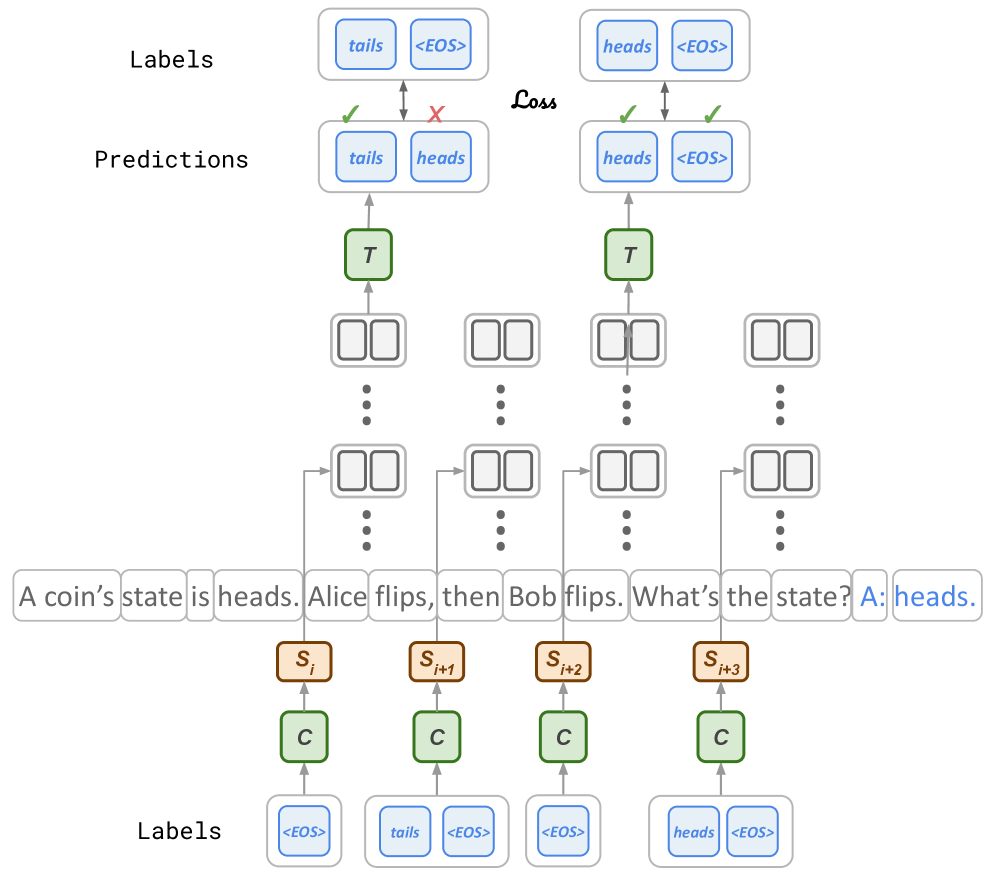
The image depicts a sequence-to-sequence model, likely used for a natural language processing task. It illustrates the model's predictions against the correct labels, highlighting the loss incurred during the prediction process. The diagram shows the flow of information through the model, from input to output, and includes specific examples of input text and corresponding labels.
### Components/Axes
* **Labels (Top)**: Represents the correct or expected output. The labels are "tails <EOS>" and "heads <EOS>".
* **Predictions**: The model's predicted output. The predictions are "tails heads" and "heads <EOS>".
* **Loss**: Indicates the error between the predictions and the labels. A green checkmark indicates a correct prediction, while a red "X" indicates an incorrect prediction.
* **Input Text**: "A coin's state is heads. Alice flips, then Bob flips. What's the state? A: heads."
* **Labels (Bottom)**: Represents the correct sequence of labels corresponding to the input text. The labels are "<EOS>", "tails <EOS>", "<EOS>", and "heads <EOS>".
* **S<sub>i</sub>, S<sub>i+1</sub>, S<sub>i+2</sub>, S<sub>i+3</sub>**: Represents the hidden states of the encoder.
* **C**: Represents the context vector.
* **T**: Represents the target token.
### Detailed Analysis
The diagram illustrates a sequence-to-sequence model's prediction process.
1. **Input Sequence**: The input text "A coin's state is heads. Alice flips, then Bob flips. What's the state? A: heads." is fed into the encoder.
2. **Encoder**: The encoder processes the input sequence and generates a sequence of hidden states (S<sub>i</sub>, S<sub>i+1</sub>, S<sub>i+2</sub>, S<sub>i+3</sub>).
3. **Context Vector**: The hidden states are used to create context vectors (C).
4. **Decoder**: The decoder uses the context vectors to generate a sequence of predictions.
5. **Predictions vs. Labels**: The model's predictions are compared to the correct labels.
* In the first example, the model predicts "tails heads", but the label is "tails <EOS>". The prediction "tails" is correct (indicated by a green checkmark), but the prediction "heads" is incorrect (indicated by a red "X").
* In the second example, the model predicts "heads <EOS>", which matches the label "heads <EOS>". This prediction is correct (indicated by a green checkmark).
6. **Loss**: The loss is calculated based on the difference between the predictions and the labels.
### Key Observations
* The model correctly predicts "tails" in the first sequence but fails to predict "<EOS>".
* The model correctly predicts "heads <EOS>" in the second sequence.
* The diagram highlights the importance of predicting the correct sequence of tokens, including the end-of-sequence token "<EOS>".
### Interpretation
The diagram illustrates the workings of a sequence-to-sequence model and its ability to generate predictions based on input sequences. The model's performance is evaluated by comparing its predictions to the correct labels and calculating the loss. The diagram highlights the importance of accurately predicting the sequence of tokens, including the end-of-sequence token. The example demonstrates a scenario where the model correctly predicts the initial token but fails to predict the end-of-sequence token, resulting in a loss.