# Technical Document Extraction: Rescaled Range Analysis (Wiki)
## 1. Component Isolation
* **Header:** Contains the title "Wiki".
* **Main Chart:** A log-log scatter plot with a linear regression line.
* **Axes:**
* **Y-axis (Vertical):** Labeled "R / S" (Rescaled Range).
* **X-axis (Horizontal):** Labeled "$n$" (Observation window size).
## 2. Metadata and Labels
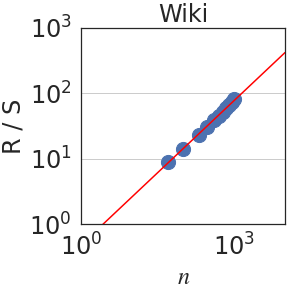
* **Title:** Wiki
* **Y-Axis Label:** R / S
* **X-Axis Label:** $n$
* **Scale:** Logarithmic (Base 10) on both axes.
* **Y-Axis Markers:** $10^0$ (1), $10^1$ (10), $10^2$ (100), $10^3$ (1000).
* **X-Axis Markers:** $10^0$ (1), $10^3$ (1000).
## 3. Data Series Analysis
The chart displays a Hurst exponent analysis or similar rescaled range statistic.
### Series 1: Empirical Data Points
* **Visual Representation:** Large blue circular markers.
* **Trend Verification:** The data points follow a strong, positive linear trend on the log-log scale, indicating a power-law relationship between $n$ and $R/S$.
* **Spatial Distribution:**
* The points begin at approximately $n \approx 10^{1.5}$ (approx. 30) and $R/S \approx 10^{0.9}$ (approx. 8).
* The points are densely clustered as they approach $n = 10^3$ (1000).
* At $n = 10^3$, the $R/S$ value is approximately $10^{1.9}$ (approx. 80).
### Series 2: Regression Line
* **Visual Representation:** A solid red line.
* **Trend Verification:** Slopes upward from left to right.
* **Spatial Grounding:**
* The line originates (within the frame) near $[10^0, 10^0]$.
* The line passes directly through the center of the blue data points, acting as a line of best fit.
* The slope appears to be less than 1 (approximately 0.7 to 0.8), which in the context of Hurst exponents ($H$), would suggest long-term positive autocorrelation in the "Wiki" dataset.
## 4. Data Table Reconstruction (Estimated from Log Scale)
| $n$ (Approximate) | $R/S$ (Approximate) |
| :--- | :--- |
| 35 | 9 |
| 60 | 15 |
| 150 | 30 |
| 400 | 50 |
| 800 | 75 |
| 1000 | 85 |
## 5. Summary of Information
This image represents a **Rescaled Range (R/S) Analysis** for a dataset titled **"Wiki"**. The plot uses a log-log scale to determine the relationship between the window size ($n$) and the rescaled range ($R/S$). The presence of a linear fit (red line) over the empirical data (blue dots) suggests that the data follows a power law $R/S \propto n^H$. Given the slope is visibly greater than 0.5 but less than 1.0, the data indicates persistent behavior (long-memory) in the underlying Wikipedia-related metric being measured.