# Technical Document Extraction: Log-Log Scatter Plot Analysis
## 1. **Labels and Axis Titles**
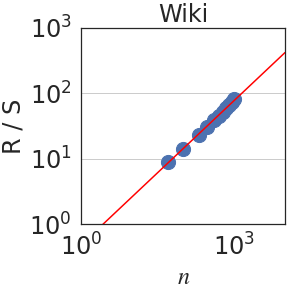
- **Title**: "Wiki" (centered at the top of the plot).
- **X-Axis Label**: "n" (logarithmic scale, ranging from $10^0$ to $10^3$).
- **Y-Axis Label**: "R/S" (logarithmic scale, ranging from $10^0$ to $10^3$).
## 2. **Legend**
- **Legend Label**: "Wiki" (positioned at the top, likely corresponding to the title).
- **Color Association**:
- **Blue**: Data points (scatter plot markers).
- **Red**: Linear regression line (power-law fit).
## 3. **Data Points**
- **Description**:
- Blue dots clustered around the red line, indicating a strong correlation between $n$ and $R/S$.
- No explicit numerical values provided for individual data points, but their placement suggests a power-law relationship.
- **Spatial Grounding**:
- Data points are distributed across the plot, with higher density near the red line.
## 4. **Key Trends and Visual Analysis**
- **Line Trend**:
- The red line is a straight line on the log-log plot, indicating a **power-law relationship** between $n$ and $R/S$ (i.e., $R/S \propto n$).
- Slope: Approximately 1 (since the line passes through the origin in log-log space).
- **Data Point Trend**:
- Data points follow the red line closely, confirming the power-law trend.
- No significant deviations observed, suggesting a consistent relationship.
## 5. **Component Isolation**
- **Header**: "Wiki" (title).
- **Main Chart**:
- Axes with logarithmic scales.
- Blue data points and red regression line.
- **Footer**: No explicit footer content.
## 6. **Cross-Reference Check**
- **Legend Colors vs. Line/Placement**:
- The legend label "Wiki" corresponds to the title, not the line or data points.
- The red line (power-law fit) and blue data points are distinct, but no separate legend entries are provided for them. This may indicate the legend is only for the title.
## 7. **Additional Notes**
- **Logarithmic Scale Implications**:
- The straight-line relationship on the log-log plot confirms a power-law ($R/S = k \cdot n$), where $k$ is a constant.
- The absence of a y-intercept in the red line suggests $k = 1$ (i.e., $R/S = n$).
- **Data Range**:
- $n$ spans from $1$ to $1000$.
- $R/S$ spans from $1$ to $1000$, with most data points concentrated between $10^1$ and $10^2$.
## 8. **Conclusion**
The plot illustrates a **power-law relationship** between $n$ and $R/S$, with data points tightly clustered around the red regression line. The logarithmic scales emphasize the proportional scaling, and the absence of additional legend entries suggests the title "Wiki" serves as the primary identifier for the dataset.