\n
## Line Chart: AIME-24 Accuracy vs Normalized Length of Thoughts
### Overview
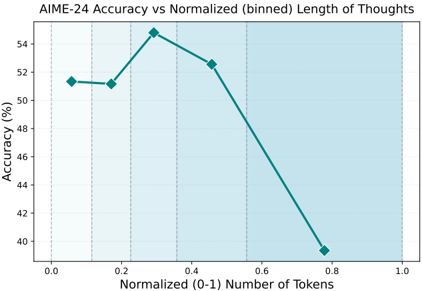
This image presents a line chart illustrating the relationship between AIME-24 accuracy and the normalized (binned) length of thoughts, measured in tokens. The chart shows how accuracy changes as the number of tokens increases, with a clear peak and subsequent decline.
### Components/Axes
* **Title:** AIME-24 Accuracy vs Normalized (binned) Length of Thoughts
* **X-axis:** Normalized (0-1) Number of Tokens. Markers are present at 0.0, 0.2, 0.4, 0.6, 0.8, and 1.0.
* **Y-axis:** Accuracy (%) . Markers are present at 40, 42, 44, 46, 48, 50, 52, 54.
* **Data Series:** A single teal-colored line representing AIME-24 accuracy.
* **Background:** A light gray grid provides visual aid for reading values. A light blue shaded region covers the range from 0.6 to 1.0 on the x-axis.
### Detailed Analysis
The line representing AIME-24 accuracy exhibits a clear trend: it initially increases, reaches a peak, and then decreases.
* **At 0.0 Normalized Tokens:** Accuracy is approximately 51.6%.
* **At 0.2 Normalized Tokens:** Accuracy increases to approximately 52.2%.
* **At 0.4 Normalized Tokens:** Accuracy reaches a peak of approximately 54.8%.
* **At 0.6 Normalized Tokens:** Accuracy begins to decline to approximately 52.6%.
* **At 0.8 Normalized Tokens:** Accuracy drops significantly to approximately 39.8%.
* **At 1.0 Normalized Tokens:** Accuracy continues to decline, but the data point is not clearly defined.
The teal line slopes upward from x=0.0 to x=0.4, indicating increasing accuracy. From x=0.4 to x=0.8, the line slopes downward, indicating decreasing accuracy. The shaded blue region on the right side of the chart (x=0.6 to x=1.0) may highlight a region where accuracy is particularly low.
### Key Observations
* The peak accuracy of approximately 54.8% is achieved at a normalized token length of 0.4.
* Accuracy decreases dramatically after 0.6 normalized tokens.
* The relationship between accuracy and token length is not linear; it follows a curved pattern.
### Interpretation
The data suggests that there is an optimal length of thought (measured in tokens) for AIME-24 to achieve the highest accuracy. Increasing the length of thought beyond this optimal point leads to a significant decrease in accuracy. This could be due to several factors:
* **Overthinking:** Longer thoughts might introduce irrelevant information or lead to confusion.
* **Noise:** As the length of thought increases, the signal-to-noise ratio may decrease.
* **Computational Limits:** The model may struggle to process and maintain coherence with very long sequences of tokens.
The shaded region from 0.6 to 1.0 may indicate a point where the model's performance degrades substantially, potentially due to the aforementioned issues. The chart highlights the importance of finding the right balance between thought length and accuracy for AIME-24. Further investigation could explore the reasons behind the accuracy decline at higher token lengths and identify strategies to mitigate this effect.