## Line Chart: AIME-24 Accuracy vs Normalized (binned) Length of Thoughts
### Overview
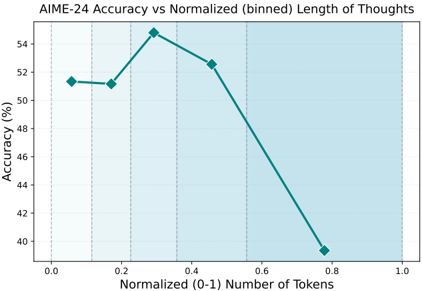
The image is a line chart plotting the relationship between the accuracy of a model (presumably on the AIME-24 benchmark) and the normalized length of its "thoughts," measured in tokens. The chart shows a non-linear relationship where accuracy first increases slightly, peaks, and then declines sharply as the normalized token count increases.
### Components/Axes
* **Chart Title:** "AIME-24 Accuracy vs Normalized (binned) Length of Thoughts"
* **Y-Axis (Vertical):**
* **Label:** "Accuracy (%)"
* **Scale:** Linear scale ranging from 40 to 54, with major tick marks every 2 units (40, 42, 44, 46, 48, 50, 52, 54).
* **X-Axis (Horizontal):**
* **Label:** "Normalized (0-1) Number of Tokens"
* **Scale:** Linear scale ranging from 0.0 to 1.0, with major tick marks every 0.2 units (0.0, 0.2, 0.4, 0.6, 0.8, 1.0).
* **Data Series:**
* **Visual Representation:** A single, solid teal-colored line connecting five data points. Each data point is marked with a teal diamond symbol.
* **Legend:** There is no separate legend box. The single data series is implicitly defined by the line and markers on the chart.
### Detailed Analysis
The chart displays five distinct data points connected by a line. The following values are approximate, read from the graph's grid.
1. **Point 1 (Far Left):**
* **X (Normalized Tokens):** ~0.05
* **Y (Accuracy %):** ~51.5%
* **Trend Start:** This is the starting point of the series.
2. **Point 2:**
* **X (Normalized Tokens):** ~0.18
* **Y (Accuracy %):** ~51.2%
* **Trend:** A very slight decrease from Point 1.
3. **Point 3 (Peak):**
* **X (Normalized Tokens):** ~0.30
* **Y (Accuracy %):** ~55.0%
* **Trend:** A sharp increase to the series' maximum value.
4. **Point 4:**
* **X (Normalized Tokens):** ~0.45
* **Y (Accuracy %):** ~52.5%
* **Trend:** A moderate decrease from the peak.
5. **Point 5 (Far Right):**
* **X (Normalized Tokens):** ~0.78
* **Y (Accuracy %):** ~39.5%
* **Trend:** A steep, significant decline to the series' minimum value.
**Overall Visual Trend:** The line exhibits an inverted "V" or a peak shape. It begins relatively flat, rises to a clear peak at a normalized token length of approximately 0.3, and then descends, with the rate of descent accelerating dramatically after the 0.45 mark.
### Key Observations
* **Peak Performance:** The highest accuracy (~55%) is achieved at an intermediate normalized token length (~0.3).
* **Sharp Decline:** There is a pronounced negative correlation between accuracy and token length beyond the peak. The drop from ~52.5% at 0.45 tokens to ~39.5% at 0.78 tokens is particularly steep.
* **Initial Plateau:** For very short thought lengths (0.05 to 0.18), accuracy remains stable around 51-52%, suggesting a minimum threshold of "thinking" is needed before performance can improve.
* **Data Range:** The plotted data does not cover the full 0-1 range of the x-axis, with no points below ~0.05 or above ~0.78.
### Interpretation
This chart suggests a **non-monotonic, "Goldilocks" relationship** between the length of a model's reasoning process (its "thoughts") and its final accuracy on the AIME-24 task.
* **Optimal Zone:** There appears to be an optimal range for the length of internal reasoning (around 30% of the normalized maximum). This implies that a certain amount of deliberation is beneficial, but more is not always better.
* **Diminishing & Negative Returns:** Beyond the optimal point, longer reasoning sequences are strongly associated with worse performance. This could indicate several underlying phenomena:
1. **Overthinking/Confusion:** The model may be getting lost in lengthy, unproductive reasoning chains, leading to errors.
2. **Resource Misallocation:** Extended "thought" might correlate with the model struggling on harder problems, where it spends more tokens but still fails.
3. **Inefficiency:** The model's reasoning process may become less focused or coherent as it generates more tokens.
* **Practical Implication:** For maximizing accuracy on this benchmark, constraining or optimizing the model's reasoning length to the identified "sweet spot" (~0.3 normalized tokens) could be a more effective strategy than simply allowing or encouraging longer chains of thought. The data argues against a "longer is better" assumption for this specific task and model.