## Line Graph: AIME-24 Accuracy vs Normalized (binned) Length of Thoughts
### Overview
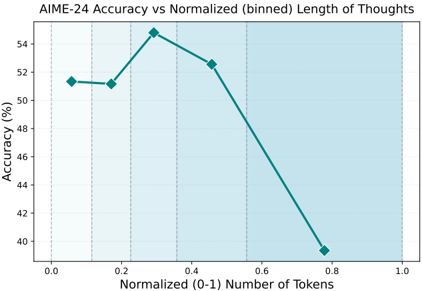
The image is a line graph depicting the relationship between normalized token length (0-1) and AIME-24 accuracy (%). The graph shows a single teal line with diamond markers, peaking at approximately 54.5% accuracy before declining sharply. A light blue shaded region spans the entire x-axis range.
### Components/Axes
- **Title**: "AIME-24 Accuracy vs Normalized (binned) Length of Thoughts" (top-center)
- **X-axis**:
- Label: "Normalized (0-1) Number of Tokens"
- Scale: 0.0 to 1.0 in increments of 0.2
- Tick marks: Dashed vertical lines at each increment
- **Y-axis**:
- Label: "Accuracy (%)"
- Scale: 40% to 54% in increments of 2%
- **Legend**: Absent
- **Shaded Region**: Light blue background covering the entire x-axis range (0.0–1.0)
### Detailed Analysis
- **Line Data**:
- **Start**: At x=0.0, accuracy is ~51% (diamond marker).
- **Peak**: At x=0.35, accuracy reaches ~54.5% (highest point).
- **Decline**: From x=0.35 to x=0.8, accuracy drops linearly to ~39.5%.
- **End**: At x=1.0, no data point is visible (line extends beyond the graph’s right edge).
- **Shaded Region**: Uniform light blue fill across the entire x-axis, no gradient or pattern.
### Key Observations
1. **Optimal Performance**: Accuracy peaks at ~0.35 normalized tokens (~35% of maximum token length).
2. **Diminishing Returns**: Beyond 0.35, accuracy declines sharply, suggesting overuse of tokens reduces performance.
3. **Initial Stability**: Accuracy remains relatively stable (~51%) between x=0.0 and x=0.2.
4. **Shaded Region Ambiguity**: The light blue shading lacks contextual labels, making its purpose unclear (e.g., confidence interval, threshold range).
### Interpretation
The data suggests an **inverted U-shaped relationship** between token length and accuracy. The peak at 0.35 tokens implies that AIME-24 performance is maximized when thoughts are moderately normalized, likely balancing depth and conciseness. Beyond this point, excessive tokenization may introduce noise, redundancy, or computational inefficiencies, degrading accuracy. The absence of a legend and unclear shaded region limits interpretation of variability or confidence bounds. The sharp decline after 0.35 tokens raises questions about the model’s sensitivity to input length and potential overfitting to shorter, more focused inputs.