\n
## Comparative Visualization: Progressive vs. Non-Progressive Point Cloud Rendering at Multiple Levels of Detail (LOD)
### Overview
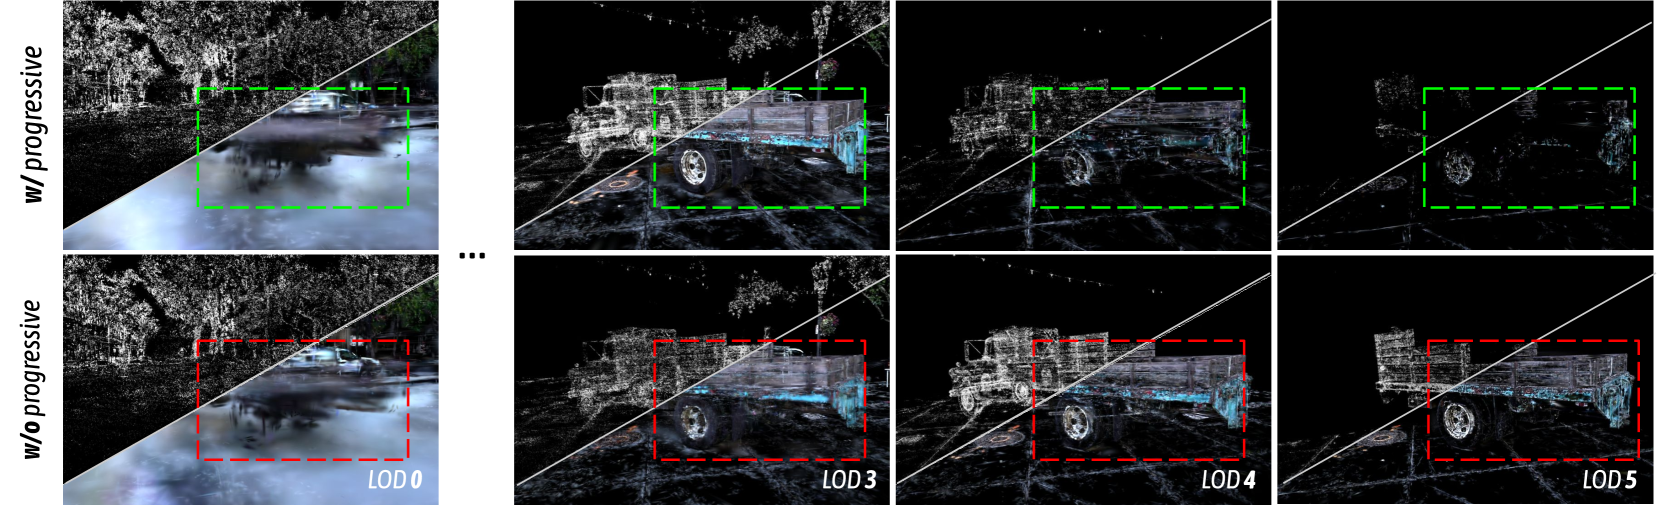
This image is a technical comparison diagram demonstrating the visual impact of a "progressive" rendering technique on a 3D point cloud scene. The scene depicts a truck in an outdoor environment. The comparison is structured as a grid with two rows and four columns, showing the same scene under different rendering conditions and Levels of Detail (LOD).
### Components/Axes
* **Rows (Rendering Method):**
* **Top Row:** Labeled vertically on the left as **"w/ progressive"** (with progressive rendering). This row uses **green dashed bounding boxes** to highlight a region of interest.
* **Bottom Row:** Labeled vertically on the left as **"w/o progressive"** (without progressive rendering). This row uses **red dashed bounding boxes** to highlight the same region of interest.
* **Columns (Level of Detail - LOD):**
* The columns represent different Levels of Detail, labeled at the bottom of the bottom row's panels.
* **Column 1 (Far Left):** Labeled **"LOD 0"**. This is the highest detail level.
* **Column 2:** Labeled **"LOD 3"**.
* **Column 3:** Labeled **"LOD 4"**.
* **Column 4 (Far Right):** Labeled **"LOD 5"**. This is the lowest detail level shown.
* **Visual Elements:**
* Each panel shows a point cloud rendering of the same truck scene against a black background.
* A white diagonal line cuts across the upper-left corner of each panel, likely indicating a camera frustum or view plane.
* Dashed bounding boxes (green for top row, red for bottom row) are consistently placed around the truck's cargo bed area across all panels for direct comparison.
* An ellipsis (`...`) is placed between the first and second columns, indicating that LOD 1 and LOD 2 are not shown in this figure.
### Detailed Analysis
The image provides a visual progression of detail loss as LOD increases (from 0 to 5) and contrasts the two rendering methods.
* **LOD 0 (Highest Detail):**
* **w/ progressive (Top-Left):** The scene is dense with points. The truck, ground, and background trees are clearly recognizable. The highlighted region (green box) shows a solid, well-defined truck bed.
* **w/o progressive (Bottom-Left):** Visually identical to the progressive version at this highest LOD. The scene is dense and clear. The highlighted region (red box) is also well-defined.
* **LOD 3:**
* **w/ progressive (Top, 2nd from left):** Point density is significantly reduced. The overall shape of the truck is maintained, but details are sparser. The truck bed within the green box remains structurally coherent.
* **w/o progressive (Bottom, 2nd from left):** Point density is similarly reduced. However, the truck bed within the red box appears more fragmented and less structurally sound compared to the progressive version above it.
* **LOD 4:**
* **w/ progressive (Top, 3rd from left):** Further reduction in points. The truck is now a sparse collection of points, but its general form and the structure of the cargo area (green box) are still discernible.
* **w/o progressive (Bottom, 3rd from left):** The degradation is more severe. The truck's form is very faint, and the cargo area (red box) is barely recognizable, appearing as a few disconnected points.
* **LOD 5 (Lowest Detail):**
* **w/ progressive (Top-Right):** Extremely sparse points. Only the most prominent features of the truck's silhouette and a few points in the cargo area (green box) remain.
* **w/o progressive (Bottom-Right):** The scene is nearly empty. The truck is almost entirely gone, with only a handful of points remaining. The cargo area (red box) is essentially empty, containing no discernible points.
### Key Observations
1. **Progressive Rendering Advantage:** The "w/ progressive" method consistently preserves more structural information and point density within the highlighted region (green boxes) as the LOD increases (detail decreases) compared to the "w/o progressive" method (red boxes).
2. **Critical Degradation Point:** The difference between the two methods becomes starkly apparent at **LOD 3** and is extreme by **LOD 4**. The non-progressive method loses critical structural data much faster.
3. **Spatial Consistency:** The bounding boxes confirm that the comparison is made on the exact same spatial region across all panels, ensuring a valid visual test.
4. **LOD Hierarchy:** The labels confirm a standard LOD hierarchy where LOD 0 is the most detailed and LOD 5 is the least detailed.
### Interpretation
This diagram serves as a visual proof-of-concept for the efficacy of a progressive point cloud rendering or compression technique. The core message is that the progressive method is superior for maintaining the perceptual integrity and structural recognizability of a 3D scene under constrained data budgets (higher LOD numbers).
* **What it demonstrates:** The technique likely involves an intelligent prioritization or ordering of point data transmission or rendering. It ensures that even when most data is discarded (at high LODs), the remaining points are chosen to preserve the most important geometric structures, like the edges and surfaces of the truck bed. The non-progressive method likely discards points uniformly or in a less intelligent manner, leading to a complete loss of structure.
* **Why it matters:** In applications like real-time 3D streaming, remote visualization, or handling massive point cloud datasets on limited hardware, this progressive approach would allow users to still understand the scene's content even under poor network conditions or at very low levels of detail. The alternative (non-progressive) rendering would render the scene useless much sooner.
* **Underlying Principle:** The image argues that not all data points are equal. A smart rendering system should prioritize the points that contribute most to human scene comprehension, which is what the "w/ progressive" method appears to achieve. The green vs. red box contrast is a direct visual metaphor for "good" vs. "bad" data preservation under compression.