## Heatmap: Mean Passage Rate
### Overview
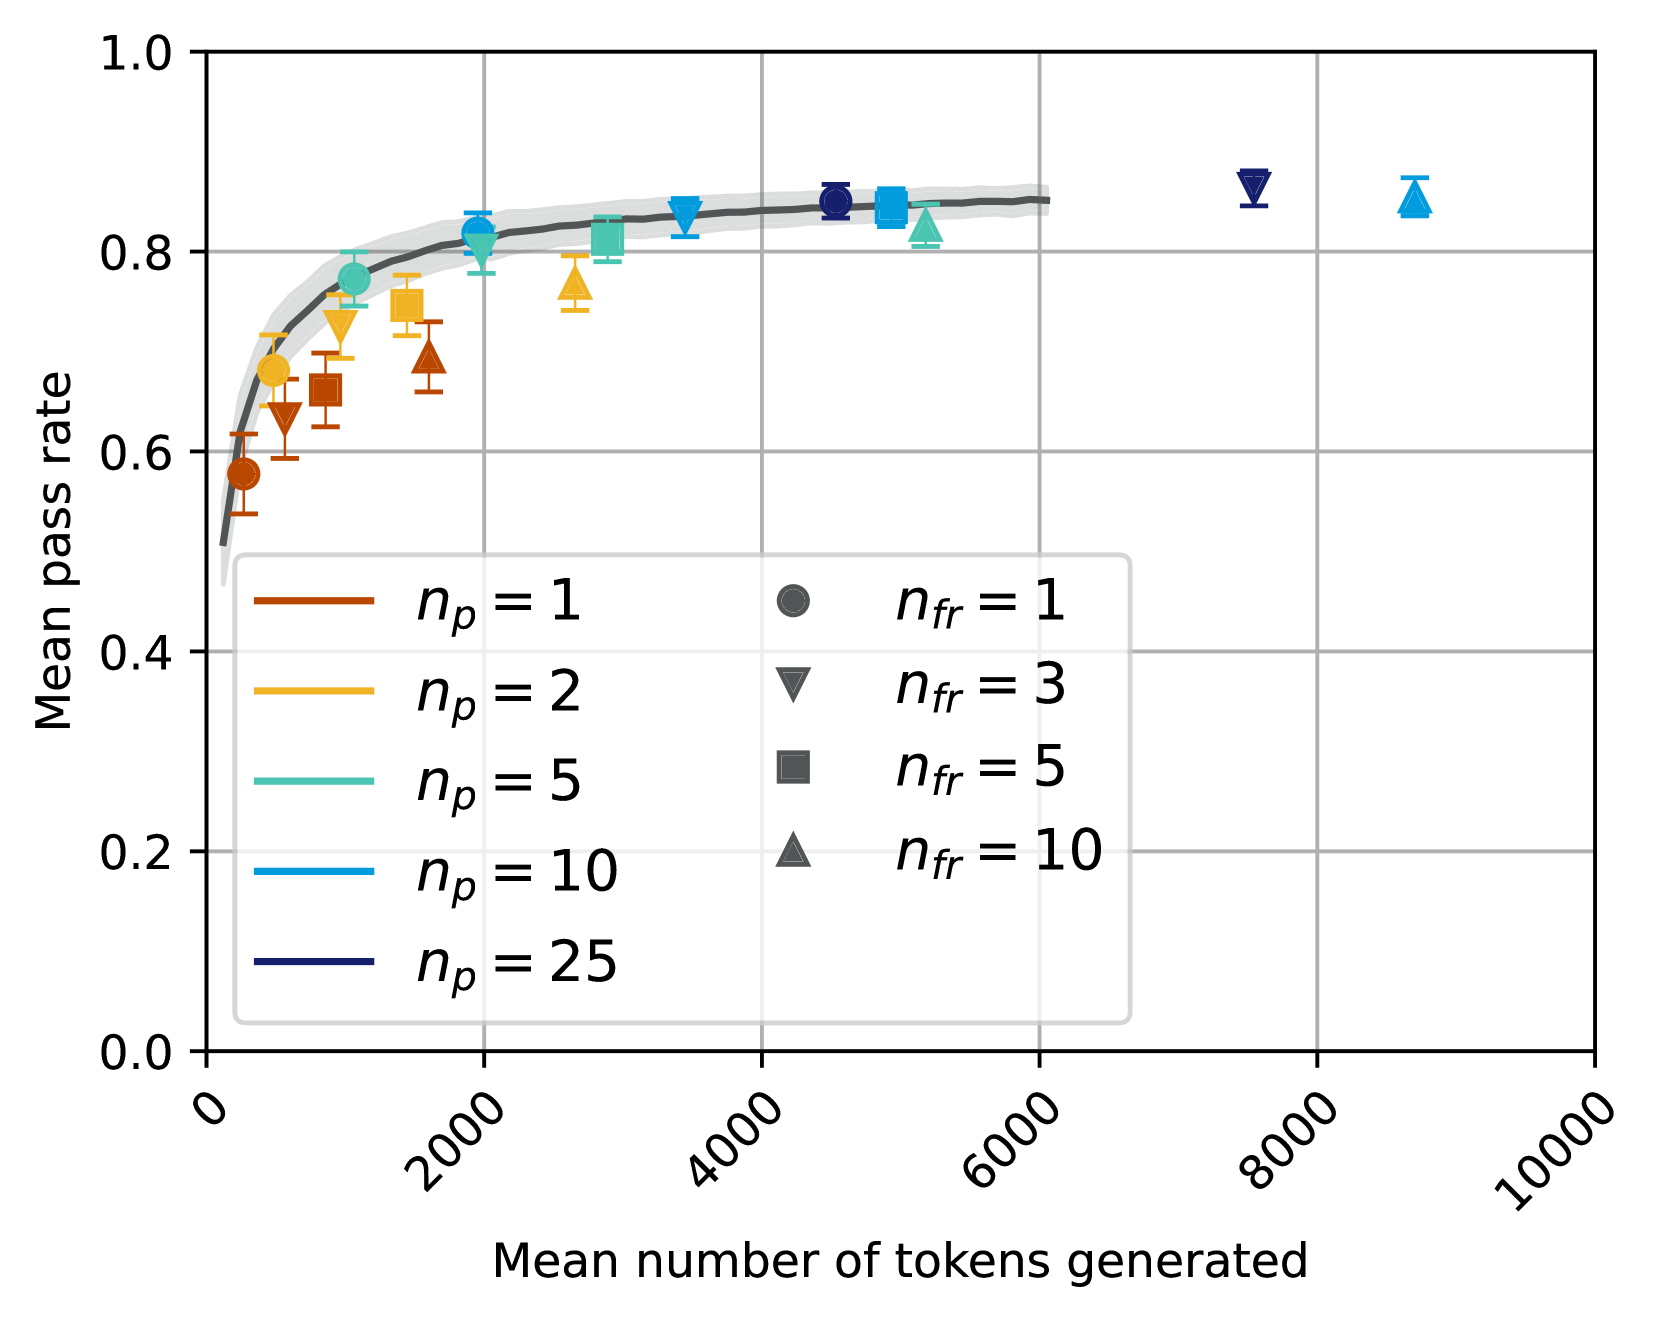
The heatmap illustrates the mean passage rate of different models as the mean number of tokens generated increases. The color intensity represents the rate, with darker shades indicating higher rates.
### Components/Axes
- **X-axis**: Mean number of tokens generated
- **Y-axis**: Mean passage rate
- **Legend**:
- **n_p = 1**: Dark blue
- **n_p = 2**: Light blue
- **n_p = 5**: Green
- **n_p = 10**: Yellow
- **n_p = 25**: Orange
### Detailed Analysis or ### Content Details
The heatmap shows that as the mean number of tokens generated increases, the mean passage rate also increases. However, the rate of increase varies across different models. For instance, the model with n_p = 1 has the highest mean passage rate, while the model with n_p = 25 has the lowest. The models with n_p = 5 and n_p = 10 show intermediate rates.
### Key Observations
- The model with n_p = 1 consistently has the highest mean passage rate.
- The model with n_p = 25 has the lowest mean passage rate.
- There is a noticeable trend where the mean passage rate increases with the number of tokens generated, but the rate of increase slows down as the number of tokens increases.
### Interpretation
The heatmap suggests that the model with n_p = 1 is the most efficient in terms of passage rate, generating the most tokens with the highest rate. Conversely, the model with n_p = 25 is the least efficient, generating the fewest tokens with the lowest rate. The models with n_p = 5 and n_p = 10 show a balance between efficiency and the number of tokens generated. The trend indicates that increasing the number of tokens generated generally leads to an increase in passage rate, but the rate of increase diminishes as the number of tokens increases.