## Bar Chart: Effect of RL Fine-Tuning on Game-Specific Performance
### Overview
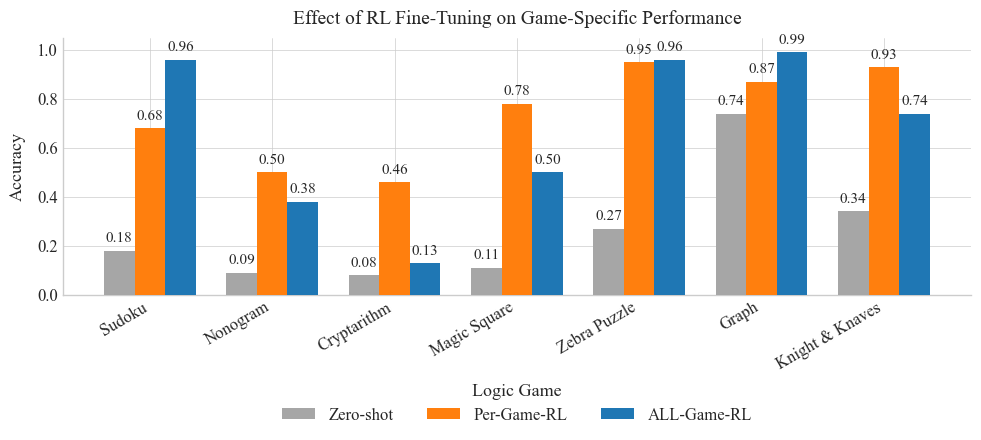
The image is a bar chart comparing the performance (accuracy) of three different methods – Zero-shot, Per-Game-RL, and ALL-Game-RL – across six different logic games: Sudoku, Nonogram, Cryptarithm, Magic Square, Zebra Puzzle, Graph, and Knight & Knaves. The chart visualizes how fine-tuning with reinforcement learning (RL) impacts the performance on these games.
### Components/Axes
* **Title:** Effect of RL Fine-Tuning on Game-Specific Performance
* **X-axis:** Logic Game (Categories: Sudoku, Nonogram, Cryptarithm, Magic Square, Zebra Puzzle, Graph, Knight & Knaves)
* **Y-axis:** Accuracy (Scale: 0.0 to 1.0, with gridlines at intervals of 0.2)
* **Legend:** Located at the bottom of the chart.
* Zero-shot (Gray)
* Per-Game-RL (Orange)
* ALL-Game-RL (Blue)
### Detailed Analysis
Here's a breakdown of the accuracy for each game and method:
* **Sudoku:**
* Zero-shot: 0.18
* Per-Game-RL: 0.68
* ALL-Game-RL: 0.96
* **Nonogram:**
* Zero-shot: 0.09
* Per-Game-RL: 0.50
* ALL-Game-RL: 0.38
* **Cryptarithm:**
* Zero-shot: 0.08
* Per-Game-RL: 0.46
* ALL-Game-RL: 0.13
* **Magic Square:**
* Zero-shot: 0.11
* Per-Game-RL: 0.78
* ALL-Game-RL: 0.50
* **Zebra Puzzle:**
* Zero-shot: 0.27
* Per-Game-RL: 0.95
* ALL-Game-RL: 0.96
* **Graph:**
* Zero-shot: 0.74
* Per-Game-RL: 0.87
* ALL-Game-RL: 0.99
* **Knight & Knaves:**
* Zero-shot: 0.34
* Per-Game-RL: 0.93
* ALL-Game-RL: 0.74
### Key Observations
* **ALL-Game-RL generally outperforms Zero-shot:** In most games, the blue bars (ALL-Game-RL) are significantly higher than the gray bars (Zero-shot), indicating that fine-tuning with RL improves performance compared to no fine-tuning.
* **Per-Game-RL shows mixed results:** The orange bars (Per-Game-RL) sometimes outperform ALL-Game-RL (e.g., Knight & Knaves), but not always.
* **Significant performance variation across games:** The accuracy varies greatly depending on the game, suggesting that the effectiveness of RL fine-tuning is game-dependent.
* **Outlier:** For the "Graph" game, the Zero-shot performance is relatively high (0.74) compared to other games.
### Interpretation
The chart demonstrates the impact of reinforcement learning (RL) fine-tuning on the performance of AI agents across different logic games. The results suggest that fine-tuning, especially with the ALL-Game-RL approach, generally improves performance compared to a Zero-shot approach. However, the effectiveness of each method varies depending on the specific game.
The high Zero-shot performance on the "Graph" game could indicate that the initial model is already well-suited for this type of problem, reducing the need for extensive fine-tuning. The mixed results of Per-Game-RL suggest that fine-tuning on individual games might not always generalize well, and a more comprehensive approach like ALL-Game-RL could be more effective in some cases.
Overall, the data highlights the potential benefits of RL fine-tuning for improving AI performance on logic games, but also emphasizes the importance of considering the specific characteristics of each game when choosing a fine-tuning strategy.