## Heatmap Grid: Task Performance by Layer and Head
### Overview
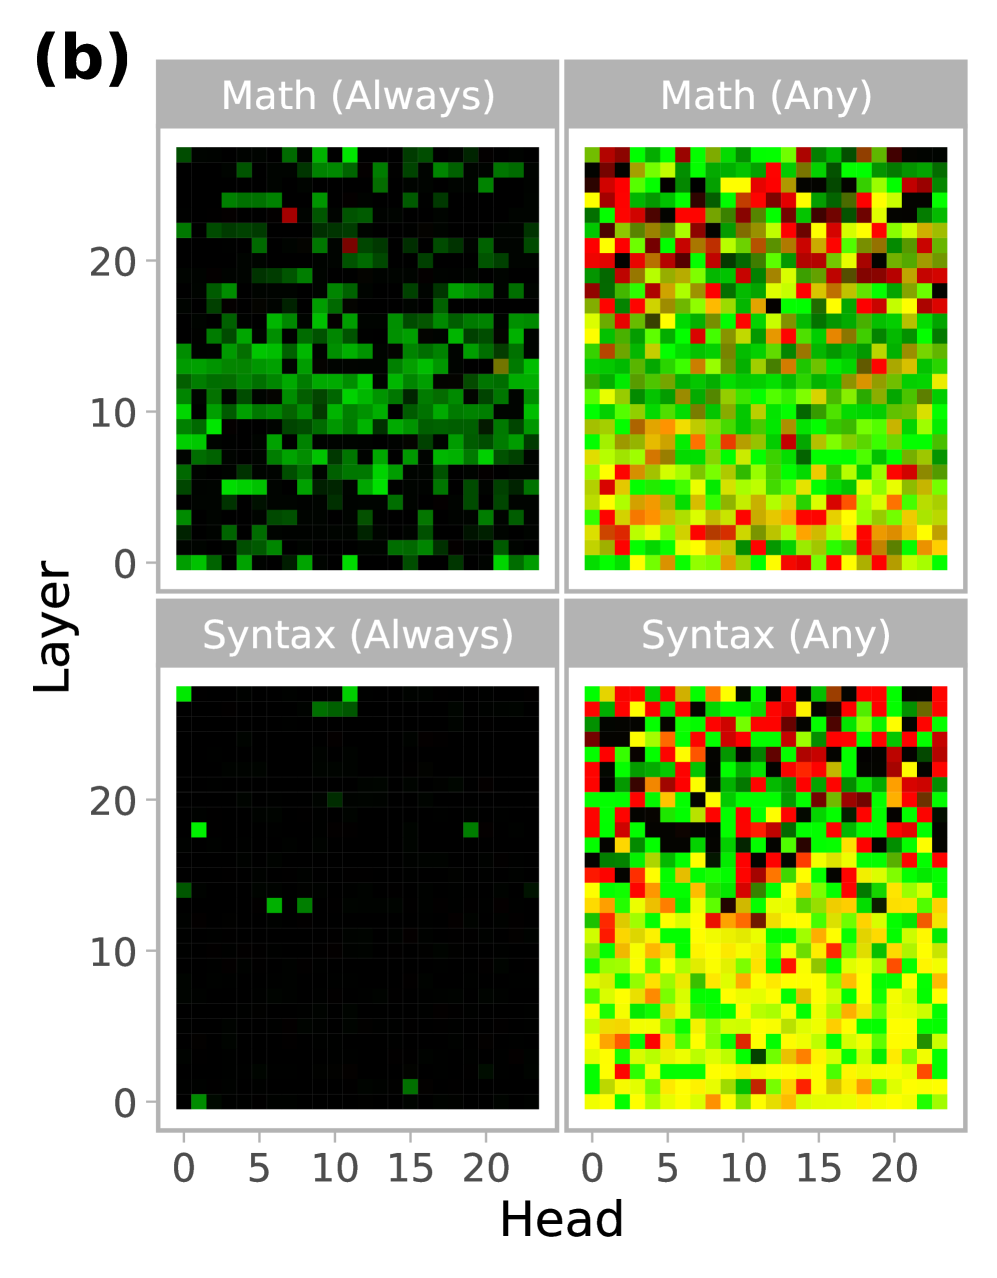
The image presents four heatmaps arranged in a 2x2 grid. Each heatmap visualizes the performance of different layers and heads in a model on specific tasks: "Math (Always)", "Math (Any)", "Syntax (Always)", and "Syntax (Any)". The heatmaps use color to represent performance, with darker colors indicating lower performance and lighter/brighter colors indicating higher performance.
### Components/Axes
* **Title:** The image is labeled "(b)" in the top-left corner.
* **X-axis:** Labeled "Head", with tick marks at 0, 5, 10, 15, and 20. The x-axis represents the head number.
* **Y-axis:** Labeled "Layer", with tick marks at 0, 10, and 20. The y-axis represents the layer number.
* **Heatmaps:** Four heatmaps are displayed, each representing a different task:
* Top-left: "Math (Always)"
* Top-right: "Math (Any)"
* Bottom-left: "Syntax (Always)"
* Bottom-right: "Syntax (Any)"
* **Color Scale:** The color scale is implied, with darker colors (likely black or dark green) representing lower performance and lighter/brighter colors (green, yellow, red) representing higher performance.
### Detailed Analysis
**Math (Always):**
* The heatmap is predominantly dark green, indicating generally low performance.
* There are a few scattered lighter green and red pixels, suggesting slightly better performance in some layer/head combinations.
* The performance appears relatively consistent across different heads for a given layer.
**Math (Any):**
* This heatmap shows a wider range of performance.
* The upper layers (around Layer 20) show a mix of red, yellow, and green, indicating varying performance across different heads.
* The lower layers (around Layer 0) are mostly green and yellow, suggesting moderate performance.
**Syntax (Always):**
* This heatmap is almost entirely black, indicating very poor performance across all layers and heads.
* There are a few scattered green pixels, but they are rare.
**Syntax (Any):**
* Similar to "Math (Any)", this heatmap shows a wider range of performance.
* The upper layers (around Layer 20) show a mix of red, yellow, and green, indicating varying performance across different heads.
* The lower layers (around Layer 0) are mostly yellow and green, suggesting moderate performance.
### Key Observations
* The "Always" tasks (Math and Syntax) show significantly lower performance compared to the "Any" tasks.
* The "Syntax (Always)" task has the lowest performance overall.
* The upper layers (around Layer 20) tend to show more variability in performance across different heads compared to the lower layers.
### Interpretation
The heatmaps suggest that the model struggles with tasks that require consistent application of math or syntax rules ("Always" tasks). When the task allows for more flexibility ("Any" tasks), the model performs better, especially in the upper layers. The poor performance on "Syntax (Always)" indicates a potential weakness in consistently applying syntactic rules. The variability in the upper layers suggests that different heads specialize in different aspects of the tasks. The lower layers may be learning more general features that are less task-specific.