## 2x2 Grid of Heatmaps: (b) - Layer vs. Head Activation Patterns
### Overview
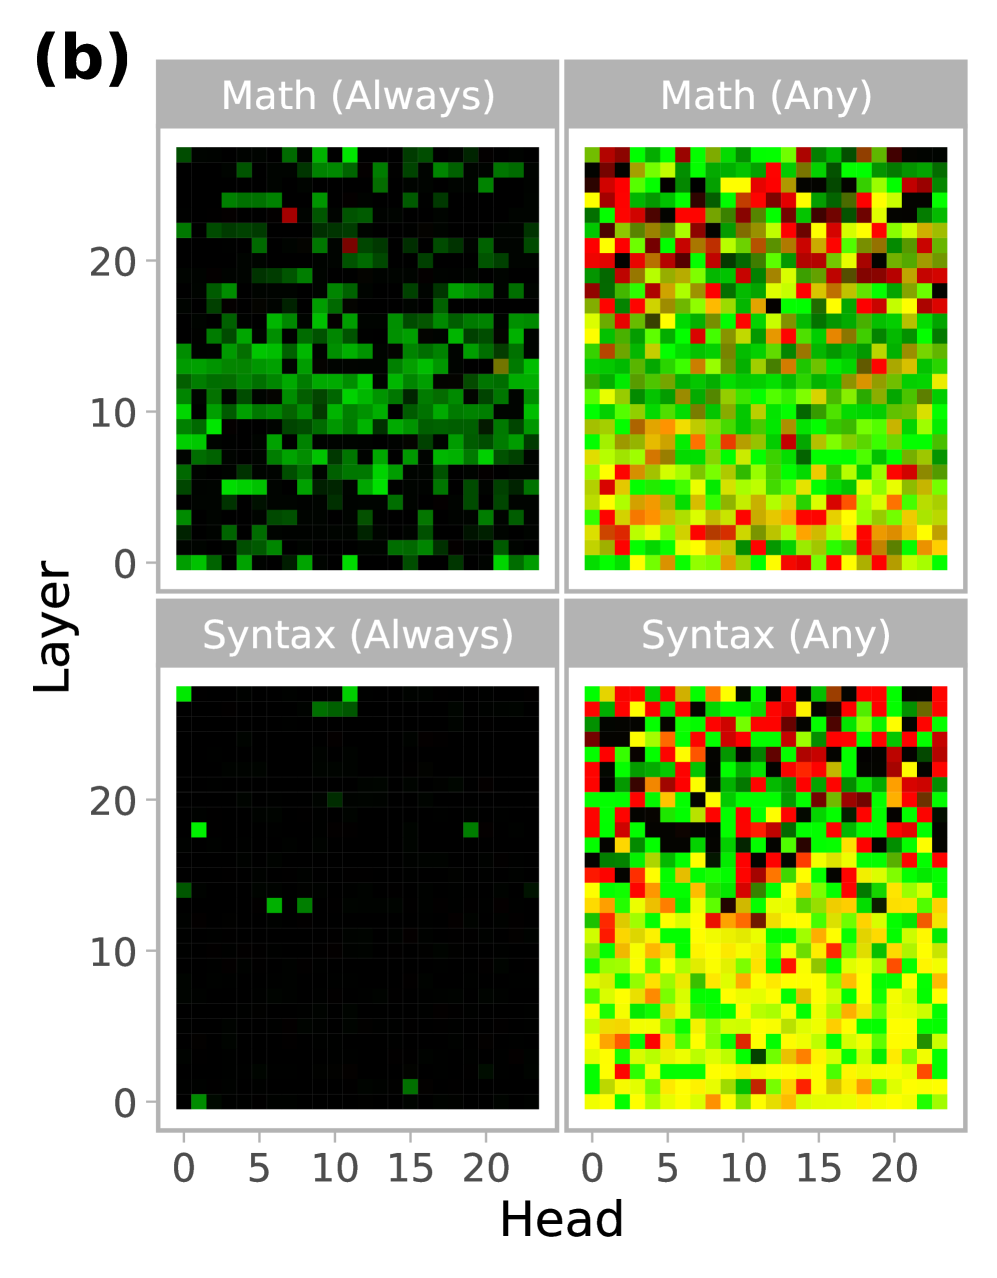
The image displays a 2x2 grid of heatmaps labeled "(b)". Each heatmap visualizes a relationship between "Layer" (y-axis) and "Head" (x-axis), likely representing attention heads across layers in a neural network model. The four subplots compare two categories ("Math" and "Syntax") under two different conditions ("Always" and "Any"). The color intensity within each cell of the grid represents a quantitative value, with a color scale ranging from black (low/zero) through green, yellow, to red (high).
### Components/Axes
* **Overall Structure:** A 2x2 grid of square heatmaps.
* **Main Label:** "(b)" is positioned in the top-left corner, outside the grid.
* **Subplot Titles (in gray header bars):**
* Top-Left: "Math (Always)"
* Top-Right: "Math (Any)"
* Bottom-Left: "Syntax (Always)"
* Bottom-Right: "Syntax (Any)"
* **Y-Axis (Common to all subplots):** Labeled "Layer". The axis is marked with ticks at 0, 10, and 20. The scale appears to run from 0 to approximately 24, based on the grid size.
* **X-Axis (Common to all subplots):** Labeled "Head". The axis is marked with ticks at 0, 5, 10, 15, and 20. The scale appears to run from 0 to approximately 23, based on the grid size.
* **Color Scale (Implicit):** No explicit legend is provided. The color gradient is inferred from the data: Black → Dark Green → Bright Green → Yellow → Orange → Red. This likely represents a metric such as activation strength, importance score, or frequency.
### Detailed Analysis
Each heatmap is a grid of approximately 24 rows (Layers 0-23) by 24 columns (Heads 0-23).
**1. Math (Always) - Top-Left Heatmap:**
* **Trend/Pattern:** Sparse activation. The majority of cells are black, indicating a value of zero or near-zero.
* **Data Distribution:** Activations (green pixels) are scattered, with a slightly higher concentration in the lower half of the layers (Layers 0-12). Very few yellow or red pixels are present. The pattern is irregular with no clear diagonal or block structure.
**2. Math (Any) - Top-Right Heatmap:**
* **Trend/Pattern:** Dense, high-value activation across the entire grid.
* **Data Distribution:** Nearly every cell is colored. There is a strong presence of red and yellow pixels, particularly in the upper half of the layers (Layers 12-23). The lower layers (0-12) show a dense mix of green and yellow. The distribution appears relatively uniform without large black voids.
**3. Syntax (Always) - Bottom-Left Heatmap:**
* **Trend/Pattern:** Extremely sparse activation, the sparsest of the four.
* **Data Distribution:** The map is almost entirely black. Only a handful of isolated green pixels are visible (e.g., near Layer 18, Head 1; Layer 13, Head 7; Layer 13, Head 9; Layer 24, Head 0). No yellow or red pixels are discernible.
**4. Syntax (Any) - Bottom-Right Heatmap:**
* **Trend/Pattern:** Dense activation, similar in density to "Math (Any)" but with a different color distribution.
* **Data Distribution:** The grid is fully populated. The lower half (Layers 0-12) is dominated by yellow and green pixels. The upper half (Layers 12-23) shows a significant increase in red and orange pixels, indicating higher values in deeper layers. The transition from yellow/green to red/orange is more pronounced than in the "Math (Any)" plot.
### Key Observations
1. **Condition Contrast ("Always" vs. "Any"):** The most striking difference is between the "Always" and "Any" conditions. "Always" heatmaps (left column) are extremely sparse, while "Any" heatmaps (right column) are densely populated. This suggests the "Always" condition is highly selective, activating only a few specific head-layer combinations, whereas the "Any" condition is permissive, activating most combinations.
2. **Category Contrast ("Math" vs. "Syntax"):** Under the "Always" condition, "Math" shows more activations than "Syntax". Under the "Any" condition, both are dense, but "Syntax (Any)" shows a clearer stratification, with lower-value colors (yellow/green) in early layers and higher-value colors (red/orange) in later layers.
3. **Layer Gradient in "Any" Conditions:** Both "Math (Any)" and "Syntax (Any)" exhibit a trend where higher-value colors (red) become more prevalent in the upper rows (higher layer numbers). This is more distinct in the "Syntax (Any)" plot.
### Interpretation
This visualization likely analyzes the specialization of attention heads in a transformer-based model for processing mathematical versus syntactic information. The "Always" and "Any" conditions probably refer to different criteria for identifying a head's function (e.g., "Always active for math tasks" vs. "Active for any math task").
* **Functional Sparsity:** The "Always" plots demonstrate extreme functional sparsity. Very few heads are consistently dedicated to a single task type (Math or Syntax). This aligns with the understanding that neural network functions are often distributed.
* **Distributed Representation:** The "Any" plots show that when the criterion is relaxed, nearly all heads participate to some degree in both math and syntax processing. This suggests a highly distributed representation where most heads contribute to multiple functions.
* **Layer-wise Specialization:** The concentration of higher values (red) in deeper layers (higher numbers) for the "Any" conditions, especially for Syntax, suggests that more abstract or task-specific processing may occur in the later stages of the network. Early layers may handle more general features.
* **Math vs. Syntax:** The fact that "Math (Always)" has more activations than "Syntax (Always)" could indicate that mathematical processing requires more consistently dedicated resources than syntactic processing within this model. Conversely, the dense "Syntax (Any)" map with its clear layer gradient suggests syntax processing is a fundamental, network-wide operation that becomes more pronounced in deeper layers.
All text in the image is in English.