## Bar Chart: 1-shot and 5-shot Accuracy Comparison for Matching and Prototypical Networks
### Overview
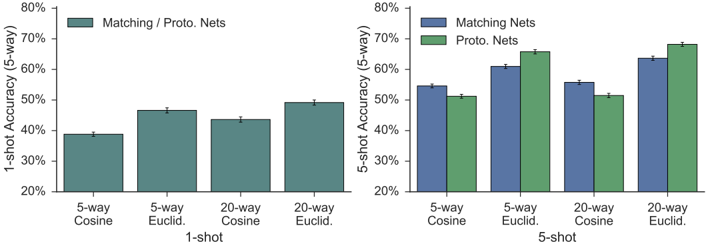
The image consists of two side-by-side bar charts comparing the performance of "Matching Nets" and "Proto. Nets" (Prototypical Networks). The left chart displays performance for "1-shot" tasks, while the right chart displays performance for "5-shot" tasks. Both charts evaluate performance across four configurations: 5-way Cosine, 5-way Euclid., 20-way Cosine, and 20-way Euclid.
### Components/Axes
* **Y-Axes:** Both charts share the same Y-axis scale, labeled "Accuracy (5-way)" ranging from 20% to 80%.
* **X-Axes:** Both charts share the same categorical labels: "5-way Cosine", "5-way Euclid.", "20-way Cosine", and "20-way Euclid."
* **Legends:**
* **Left Chart (1-shot):** Located at the top-left. It contains a single teal-colored bar icon labeled "Matching / Proto. Nets".
* **Right Chart (5-shot):** Located at the top-left. It contains two colored bar icons: Blue labeled "Matching Nets" and Green labeled "Proto. Nets".
* **Error Bars:** Small vertical black lines are present on top of each bar, indicating uncertainty or variance in the measurements.
### Detailed Analysis
#### Left Chart: 1-shot Accuracy
*Note: This chart uses a single teal color for all bars, suggesting a combined or singular baseline representation for the 1-shot task.*
| Configuration | Accuracy |
| :--- | :--- |
| 5-way Cosine | ~39% |
| 5-way Euclid. | ~47% |
| 20-way Cosine | ~44% |
| 20-way Euclid. | ~49% |
#### Right Chart: 5-shot Accuracy
*Note: This chart uses Blue for "Matching Nets" and Green for "Proto. Nets".*
| Configuration | Matching Nets (Blue) | Proto. Nets (Green) |
| :--- | :--- | :--- |
| 5-way Cosine | ~55% | ~51% |
| 5-way Euclid. | ~61% | ~66% |
| 20-way Cosine | ~56% | ~51% |
| 20-way Euclid. | ~64% | ~68% |
### Key Observations
* **Metric Performance:** Across all categories in both charts, the Euclidean distance metric ("Euclid.") consistently yields higher accuracy than the Cosine distance metric ("Cosine").
* **5-shot Performance Gap:** In the 5-shot scenario, there is a clear divergence in performance based on the architecture:
* **Matching Nets** perform better with **Cosine** distance compared to Proto. Nets.
* **Proto. Nets** perform significantly better with **Euclidean** distance compared to Matching Nets.
* **Task Complexity:** Increasing the task complexity from 5-way to 20-way generally results in higher accuracy values in the 1-shot chart, which is counter-intuitive for standard classification tasks (usually accuracy drops as the number of classes increases), suggesting these might be specific few-shot learning benchmarks where the "way" count affects the difficulty differently or the dataset size scales accordingly.
### Interpretation
The data demonstrates that the choice of distance metric is highly dependent on the underlying model architecture. Prototypical Networks (Proto. Nets) appear to be highly optimized for Euclidean distance, achieving their highest accuracy in the 5-shot, 20-way Euclidean configuration (~68%). Conversely, Matching Nets show more stability or preference for Cosine distance, outperforming Proto. Nets in both 5-way and 20-way Cosine configurations. The 1-shot chart, lacking a distinction between the two models, suggests that in lower-data regimes, the performance gap between these two architectures may be negligible or that the provided data represents a baseline where the two models converged to similar performance levels.