## Diagram: MCTS-driven Deep Thinking and Self-Evolution
### Overview
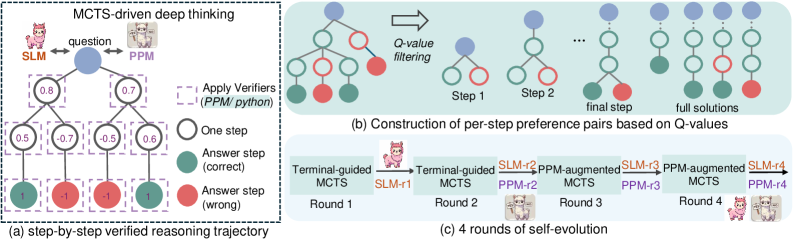
The image illustrates a Monte Carlo Tree Search (MCTS)-driven deep thinking process, including a step-by-step verified reasoning trajectory, construction of per-step preference pairs based on Q-values, and 4 rounds of self-evolution. The diagram uses tree structures and flowcharts to represent the reasoning and learning processes.
### Components/Axes
* **General Layout:** The image is divided into three sub-diagrams labeled (a), (b), and (c). Each sub-diagram represents a different aspect of the MCTS-driven deep thinking process.
* **Nodes:** Blue nodes represent the question or initial state. Green nodes represent correct answer steps. Red nodes represent wrong answer steps. White nodes represent one step.
* **Edges:** Edges connect the nodes, representing the flow of reasoning.
* **Labels:**
* **MCTS-driven deep thinking:** Title of the overall process.
* **SLM:** Represents one agent, depicted as a pink llama.
* **PPM:** Represents another agent, depicted as a white llama.
* **question:** Label near the top-most node in diagram (a).
* **Apply Verifiers (PPM/python):** Label indicating the application of verifiers.
* **Q-value filtering:** Label indicating the filtering process based on Q-values.
* **Step 1, Step 2, final step, full solutions:** Labels indicating the stages of constructing per-step preference pairs.
* **Terminal-guided MCTS:** Label for the initial MCTS stage.
* **PPM-augmented MCTS:** Label for the augmented MCTS stage.
* **Round 1, Round 2, Round 3, Round 4:** Labels indicating the rounds of self-evolution.
* **SLM-r1, PPM-r2, SLM-r3, PPM-r4:** Labels indicating the agents involved in each round.
### Detailed Analysis
#### (a) Step-by-step Verified Reasoning Trajectory
* **Description:** This sub-diagram shows a tree structure representing the reasoning process. The tree starts with a blue node labeled "question" at the top.
* **Nodes and Values:**
* The root node (question) has two child nodes with values 0.8 (left) and 0.7 (right).
* The left child node (0.8) has two children with values 0.5 (left) and -0.7 (right).
* The right child node (0.7) has two children with values -0.5 (left) and 0.6 (right).
* The left-most leaf node has a value of 1 and is colored green (correct).
* The second leaf node has a value of -1 and is colored red (wrong).
* The third leaf node has a value of -1 and is colored red (wrong).
* The right-most leaf node has a value of 1 and is colored green (correct).
* **Verifiers:** Dashed purple boxes surround each node, indicating the application of verifiers (PPM/python).
#### (b) Construction of Per-Step Preference Pairs Based on Q-Values
* **Description:** This sub-diagram illustrates the construction of per-step preference pairs through Q-value filtering.
* **Process:** The diagram shows a sequence of tree structures, starting with a more complex tree and gradually simplifying to "full solutions".
* **Stages:**
* The initial tree has a blue root node, followed by green and red nodes.
* "Q-value filtering" is applied, leading to simpler trees in "Step 1" and "Step 2".
* The "final step" shows a tree with a blue root node and a green and red child node.
* "full solutions" shows a linear sequence of blue and green nodes.
#### (c) 4 Rounds of Self-Evolution
* **Description:** This sub-diagram shows a flowchart representing 4 rounds of self-evolution.
* **Process:** The process starts with "Terminal-guided MCTS" in Round 1, followed by "PPM-augmented MCTS" in Round 3, alternating between the two agents (SLM and PPM).
* **Agents:**
* Round 1: Terminal-guided MCTS, SLM-r1
* Round 2: Terminal-guided MCTS, PPM-r2, SLM-r2
* Round 3: PPM-augmented MCTS, PPM-r3, SLM-r3
* Round 4: PPM-augmented MCTS, PPM-r4, SLM-r4
### Key Observations
* The reasoning trajectory in (a) shows a branching process with associated values at each step.
* The Q-value filtering in (b) simplifies the tree structure, leading to a set of full solutions.
* The self-evolution process in (c) involves alternating between Terminal-guided and PPM-augmented MCTS, with the SLM and PPM agents taking turns.
### Interpretation
The diagram illustrates a deep learning approach where an MCTS algorithm is used for reasoning and problem-solving. The step-by-step verification process ensures the quality of the reasoning trajectory. The Q-value filtering helps to refine the solutions. The self-evolution process allows the agents (SLM and PPM) to learn and improve over time through interaction and augmentation. The use of two agents suggests a collaborative or adversarial learning setup. The diagram highlights the iterative and adaptive nature of the learning process.