\n
## Diagram: MCTS-driven Deep Thinking Process
### Overview
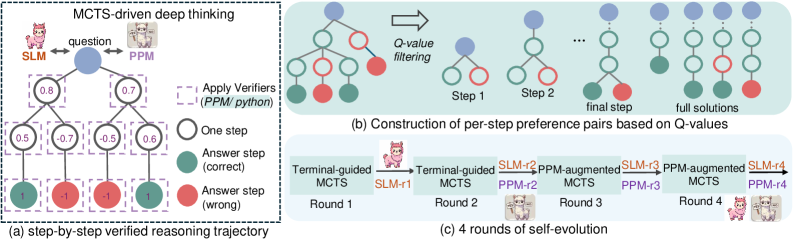
The image depicts a diagram illustrating the process of MCTS (Monte Carlo Tree Search)-driven deep thinking, specifically focusing on a step-by-step verified reasoning trajectory, the construction of preference pairs based on Q-values, and iterative self-evolution rounds. The diagram uses tree-like structures and icons to represent the reasoning process and model evolution.
### Components/Axes
The diagram is divided into three main sections: (a), (b), and (c). Section (a) shows a step-by-step reasoning trajectory. Section (b) illustrates the construction of preference pairs. Section (c) demonstrates four rounds of self-evolution. The diagram includes icons representing SLM (a pink cartoon character) and PPM (a grey cartoon character). The diagram also uses color-coding: green for correct answer steps, red for incorrect answer steps, blue for nodes in the tree, and varying shades of red/green for Q-values.
### Detailed Analysis or Content Details
**(a) Step-by-Step Verified Reasoning Trajectory:**
* **Initial State:** A question is posed, and the process begins with SLM and PPM.
* **Nodes & Values:** The reasoning process unfolds as a tree. Nodes are represented by circles.
* The first node (leftmost) has a value of 0.8.
* The next two nodes have values of 0.7 and 0.7.
* Following these, there are nodes with values 0.5, -0.7, 0.5, and 0.6.
* The final nodes represent answer steps: 1 (green, correct), -1 (red, wrong), -1 (red, wrong), and 1 (green, correct).
* **Process Flow:** The diagram shows a flow from the initial question through a series of reasoning steps, culminating in an answer step. A dashed box surrounds the reasoning steps, labeled "One step".
* **Verifiers:** A dashed box labeled "Apply Verifiers (PPM/python)" indicates the use of verifiers to assess the reasoning steps.
**(b) Construction of Per-Step Preference Pairs Based on Q-Values:**
* **Initial Tree:** A tree structure with nodes colored green and red.
* **Q-Value Filtering:** An arrow indicates a filtering process based on Q-values.
* **Step 1 & Step 2:** The diagram shows two steps in the construction of preference pairs.
* **Final Step & Full Solutions:** The process leads to identifying the final step and full solutions.
**(c) 4 Rounds of Self-Evolution:**
* **Round 1:** Terminal-guided MCTS.
* **Round 2:** Terminal-guided SLM-r1.
* **Round 3:** SLM-r2 and PPM-augmented MCTS.
* **Round 4:** SLM-r3 and PPM-augmented MCTS, SLM-r4 and PPM-r4.
* **Icons:** Each round is associated with an icon representing the model (SLM or PPM).
### Key Observations
* The diagram highlights the iterative nature of the MCTS process.
* The use of Q-values suggests a reinforcement learning component.
* The self-evolution rounds demonstrate a process of model refinement.
* The color-coding clearly distinguishes between correct and incorrect reasoning steps.
* The diagram shows a clear progression from initial reasoning to refined solutions.
### Interpretation
The diagram illustrates a sophisticated AI reasoning process that combines MCTS with verification and self-improvement. The process begins with an initial question and explores possible reasoning paths, assigning Q-values to each step. These Q-values are then used to filter and refine the reasoning process, leading to the identification of optimal solutions. The self-evolution rounds suggest a continuous learning loop where the model (SLM and PPM) iteratively improves its reasoning capabilities. The use of verifiers (PPM/python) indicates a mechanism for ensuring the accuracy and reliability of the reasoning process. The diagram suggests a system designed to not only find answers but also to understand *why* those answers are correct, and to improve its reasoning abilities over time. The diagram is a conceptual illustration of a complex algorithm, rather than a presentation of specific data points. It focuses on the *process* of reasoning and improvement, rather than quantifiable results.