\n
## Diagram: Neural Network Response Characteristics
### Overview
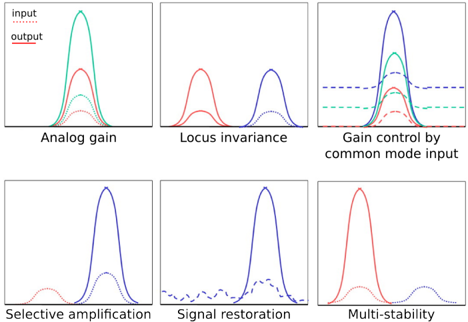
The image presents a 2x3 grid of diagrams illustrating different response characteristics of a neural network or similar system. Each diagram depicts a distribution or curve, likely representing signal strength or activation level, with different curves representing "input" and "output" signals. The diagrams are labeled with descriptive titles indicating the specific characteristic being demonstrated. There are no explicit axes labels or numerical values provided.
### Components/Axes
Each sub-diagram contains curves representing input and output signals. The legend, consistently positioned in the top-left corner of each diagram, indicates:
* **input** (represented by a dotted blue line)
* **output** (represented by a solid red or teal line).
The diagrams are labeled as follows (from top-left to bottom-right):
1. Analog gain
2. Locus invariance
3. Gain control by common mode input
4. Selective amplification
5. Signal restoration
6. Multi-stability
### Detailed Analysis or Content Details
**1. Analog Gain:**
The "input" (dotted blue) is a relatively broad distribution. The "output" (solid teal) is a narrower, taller distribution centered around the same point, indicating amplification. A smaller red curve is also present, likely representing another output.
**2. Locus Invariance:**
The "input" (dotted blue) is a relatively narrow distribution. The "output" (solid red) is a similar distribution, but shifted slightly to the right.
**3. Gain Control by Common Mode Input:**
The "input" (dotted blue) is a broad distribution. There are multiple "output" curves (solid teal, dashed blue, and dashed red). The solid teal curve is the tallest and narrowest, indicating high gain. The dashed curves are lower and broader, suggesting gain control based on a common mode input.
**4. Selective Amplification:**
The "input" (dotted blue) is a broad distribution. The "output" (solid red) is a narrow, tall distribution centered on a specific point within the input distribution, indicating selective amplification.
**5. Signal Restoration:**
The "input" (dotted blue) is a noisy, low-amplitude distribution. The "output" (solid red) is a cleaner, higher-amplitude distribution, suggesting signal restoration. A dashed blue curve is also present, representing an intermediate signal.
**6. Multi-stability:**
There are two distinct "output" curves (solid red and solid blue), each representing a stable state. The "input" (dotted blue) is a broad distribution, suggesting the system can settle into either of the two stable states depending on the input.
### Key Observations
* The diagrams visually demonstrate different functional properties of a system, likely a neural network or similar signal processing unit.
* The "output" curves are consistently modified versions of the "input" curves, illustrating the system's transformation of the input signal.
* There is a consistent use of color coding (blue for input, red/teal for output) across all diagrams.
* No quantitative data is provided; the diagrams are purely illustrative.
### Interpretation
The image serves as a conceptual overview of various response characteristics achievable in a neural network or similar system. Each diagram highlights a specific function: amplification, invariance, gain control, selective processing, signal recovery, and multi-stability. The absence of numerical data suggests the diagrams are intended to convey qualitative understanding rather than precise quantitative relationships. The diagrams are likely used in a teaching or explanatory context to illustrate the capabilities of such systems. The consistent use of "input" and "output" curves allows for a direct comparison of how the system modifies the input signal to produce the output. The "Gain control by common mode input" diagram suggests a mechanism for regulating signal strength based on external factors. The "Multi-stability" diagram indicates the system can exhibit multiple stable states, potentially enabling memory or complex decision-making.