\n
## Line Plots: Visualization of Line Distributions for Varying 'n' Values
### Overview
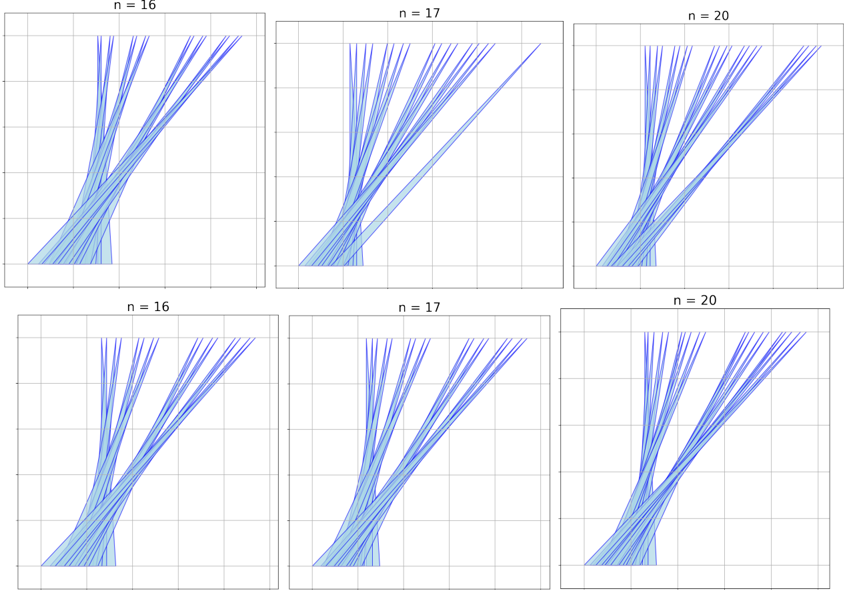
The image presents a 2x3 grid of line plots. Each plot visualizes a distribution of lines, likely representing different iterations or samples, for a specific value of 'n'. The plots appear to show lines originating from near the origin and diverging upwards and to the right, exhibiting a generally increasing trend. The 'n' values are 16, 17, and 20, and each value is represented in two separate plots. The axes are not explicitly labeled, but the plots suggest a relationship between an independent variable (x-axis) and a dependent variable (y-axis).
### Components/Axes
- **Plots:** Six individual line plots arranged in a 2x3 grid.
- **Labels:** Each plot is labeled with "n = [value]", where [value] is either 16, 17, or 20. These labels are positioned at the top-center of each plot.
- **Axes:** The x and y axes are present but lack explicit labels. The x-axis appears to range from approximately 0 to 1, while the y-axis ranges from approximately 0 to 1.
- **Lines:** Each plot contains a collection of light blue lines, representing individual samples or iterations.
### Detailed Analysis or Content Details
Each plot shows a fan-like distribution of lines. Let's analyze each 'n' value separately:
* **n = 16 (Top-Left & Bottom-Left):** The lines originate from near (0,0) and diverge upwards. The spread of the lines increases as the x-axis value increases. The lines generally maintain a positive slope. The lines appear to be more concentrated near x=0 and diverge as x increases.
* **n = 17 (Top-Center & Bottom-Center):** Similar to n=16, the lines originate near (0,0) and diverge upwards. The spread of the lines appears slightly wider than for n=16. The lines generally maintain a positive slope.
* **n = 20 (Top-Right & Bottom-Right):** The lines again originate near (0,0) and diverge upwards. The spread of the lines appears wider than for both n=16 and n=17. The lines generally maintain a positive slope.
Due to the lack of axis labels and precise data points, it's difficult to provide exact numerical values. However, we can observe the following approximate trends:
* For all 'n' values, the lines start near y=0 when x is near 0.
* As x increases, the y-values increase, indicating a positive correlation.
* The spread of the lines (variance) appears to increase with increasing 'n'.
### Key Observations
- The plots demonstrate a consistent pattern across different 'n' values: lines originating near the origin and diverging upwards.
- The spread of the lines increases as 'n' increases, suggesting a greater variance in the data for larger 'n' values.
- The repetition of each 'n' value (twice per value) suggests a comparison of two independent sets of data for each 'n'.
- The lack of axis labels limits the ability to interpret the data fully.
### Interpretation
The image likely represents a visualization of a stochastic process or a simulation where 'n' represents a parameter influencing the variability of the outcome. The lines could represent different realizations of the process, and the spread of the lines indicates the uncertainty or variance associated with each 'n' value.
The increasing spread with increasing 'n' suggests that as 'n' grows, the process becomes more unpredictable or exhibits greater variability. This could be due to the accumulation of random effects or the amplification of initial conditions.
The fact that each 'n' value is plotted twice might indicate a comparison of two different methods or conditions for the same 'n' value, or it could represent two independent runs of the same simulation. Without further context, it's difficult to determine the exact meaning of the repetition.
The plots suggest a positive relationship between the independent variable (x-axis) and the dependent variable (y-axis), but the precise nature of this relationship is unclear without axis labels. The data could be modeling a growth process, a diffusion process, or any other phenomenon where the outcome increases over time with some degree of randomness.