## Grid-Based Line Plots: n=16, 17, 20
### Overview
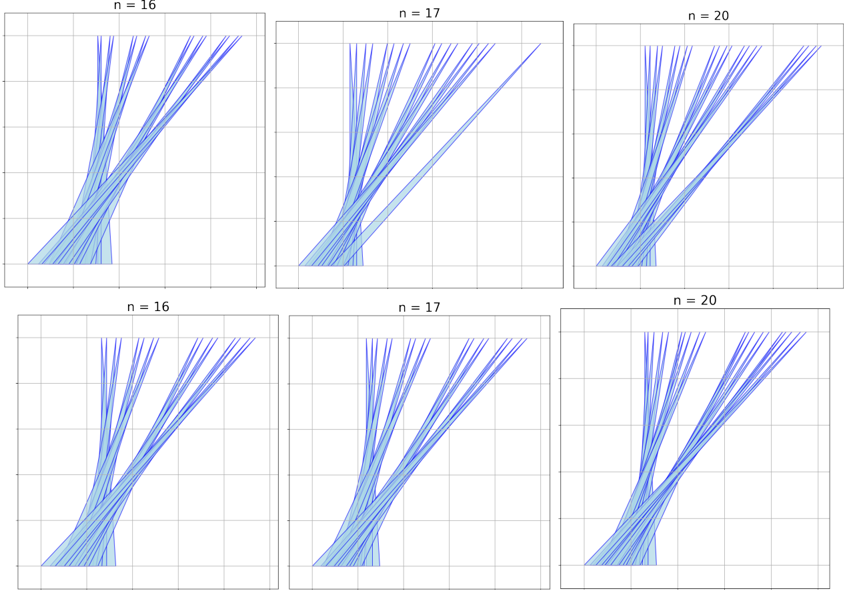
The image contains six grid-based plots arranged in two rows of three. Each plot is labeled with an integer value of `n` (16, 17, or 20) at the top. All plots feature blue lines radiating from the bottom-left corner toward the top-right, with varying density and directional alignment. No explicit axis titles, legends, or numerical data are visible.
---
### Components/Axes
- **Grid Structure**: Uniform Cartesian grids with 10x10 spacing in all plots.
- **Lines**:
- **Color**: Blue (varying opacity, darker at convergence points).
- **Behavior**:
- **Top Row**: Lines spread outward from the bottom-left, becoming sparser as `n` increases (16 → 17 → 20).
- **Bottom Row**: Lines cluster densely near the bottom-left, with increasing convergence toward the top-right as `n` increases.
- **Labels**:
- Top of each plot: `n = [16, 17, 20]` (left to right in both rows).
- No axis labels, legends, or numerical markers.
---
### Detailed Analysis
1. **Line Density and Direction**:
- **Top Row**:
- `n=16`: Lines radiate outward with moderate spacing.
- `n=17`: Lines begin to converge slightly toward the top-right.
- `n=20`: Lines are widely spaced but show a clear directional trend toward the top-right.
- **Bottom Row**:
- `n=16`: Lines cluster tightly near the bottom-left, with minimal divergence.
- `n=17`: Lines form a denser bundle, curving sharply toward the top-right.
- `n=20`: Lines are the most concentrated, forming a near-parallel alignment toward the top-right.
2. **Spatial Patterns**:
- All lines originate from the bottom-left quadrant and terminate near the top-right.
- The bottom-row plots exhibit significantly higher line density compared to the top-row plots for equivalent `n` values.
---
### Key Observations
- **Convergence Trend**: Lines in all plots trend toward the top-right, suggesting a directional relationship (e.g., growth, flow, or progression).
- **Density Correlation**: Higher `n` values correlate with increased line density in the bottom row and sparser spacing in the top row.
- **Repetition of `n` Values**: Identical `n` labels appear in both rows, implying two distinct datasets or conditions for each `n`.
---
### Interpretation
The plots likely represent a comparative analysis of a phenomenon (e.g., resource allocation, network paths, or optimization trajectories) across three scenarios (`n=16, 17, 20`). The **top row** may depict an "open" or "divergent" state, where higher `n` values allow greater variability in outcomes. The **bottom row** suggests a "constrained" or "convergent" state, where higher `n` values force alignment toward a common endpoint. The repetition of `n` values across rows implies a controlled experiment or dual modeling approach (e.g., stochastic vs. deterministic systems). The absence of legends or axis labels limits quantitative interpretation, but the visual patterns strongly suggest a relationship between `n` and the degree of convergence/density in the system.