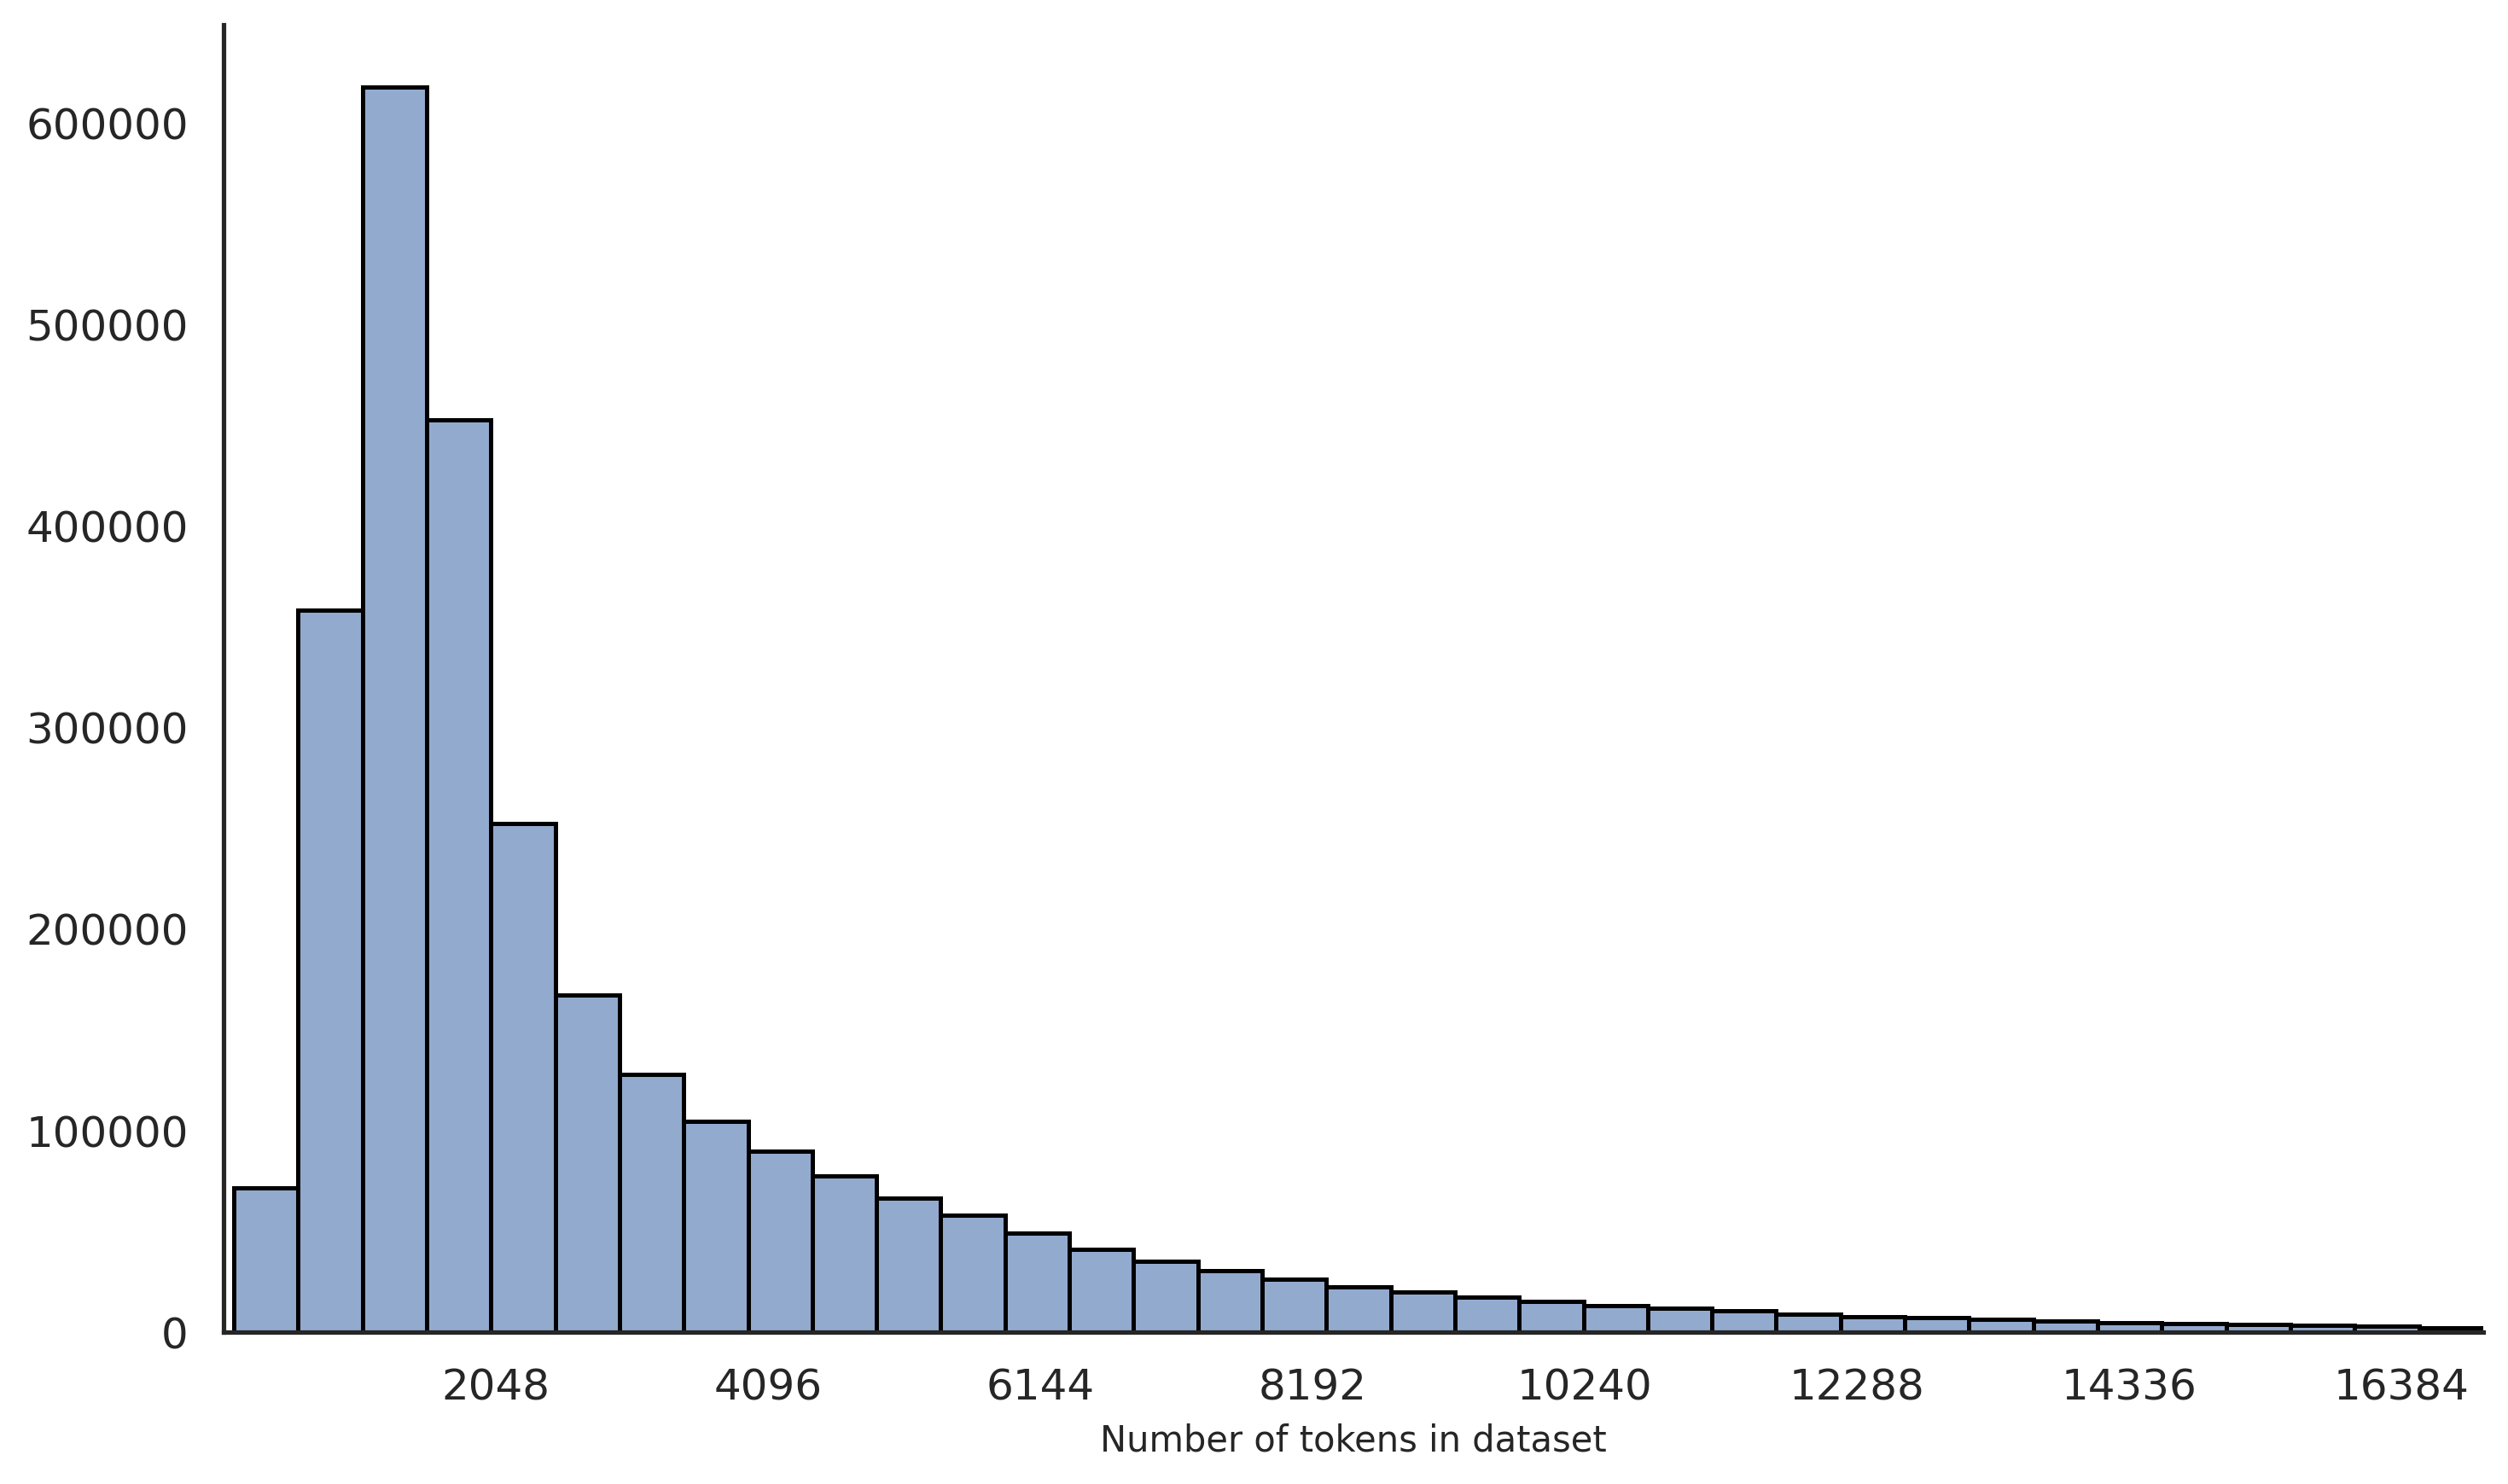
## Histogram: Number of Tokens in Dataset
### Overview
The image is a histogram showing the distribution of the number of tokens in a dataset. The x-axis represents the number of tokens, and the y-axis represents the frequency or count of datasets with that number of tokens. The histogram shows a right-skewed distribution, indicating that most datasets have a relatively small number of tokens, while a few datasets have a much larger number of tokens.
### Components/Axes
* **X-axis:** "Number of tokens in dataset". The x-axis is scaled from approximately 0 to 16384, with tick marks at 2048, 4096, 6144, 8192, 10240, 12288, 14336, and 16384.
* **Y-axis:** The y-axis represents the frequency or count. The y-axis is scaled from 0 to 600000, with tick marks at 100000, 200000, 300000, 400000, 500000, and 600000.
* **Bars:** The histogram consists of a series of bars, each representing a range of token counts. The height of each bar corresponds to the number of datasets falling within that range. The bars are light blue with black outlines.
### Detailed Analysis
The histogram bars show a decreasing trend as the number of tokens increases.
* **2048 tokens:** The bar height is approximately 620000.
* **4096 tokens:** The bar height is approximately 105000.
* **6144 tokens:** The bar height is approximately 65000.
* **8192 tokens:** The bar height is approximately 35000.
* **10240 tokens:** The bar height is approximately 15000.
* **12288 tokens:** The bar height is approximately 8000.
* **14336 tokens:** The bar height is approximately 4000.
* **16384 tokens:** The bar height is approximately 2000.
### Key Observations
* The distribution is heavily skewed to the right, with a large number of datasets having a small number of tokens.
* The frequency of datasets decreases rapidly as the number of tokens increases.
* There are very few datasets with a large number of tokens.
### Interpretation
The histogram indicates that the dataset contains a large number of relatively small text samples, and a small number of very large text samples. This could be due to a variety of factors, such as the nature of the data being collected, the way the data was preprocessed, or the specific application for which the data is being used. The skewness of the distribution suggests that the average number of tokens per dataset is likely to be much lower than the median number of tokens. This information could be useful for tasks such as text classification, language modeling, or information retrieval.