## Histogram: Distribution of Token Counts in a Dataset
### Overview
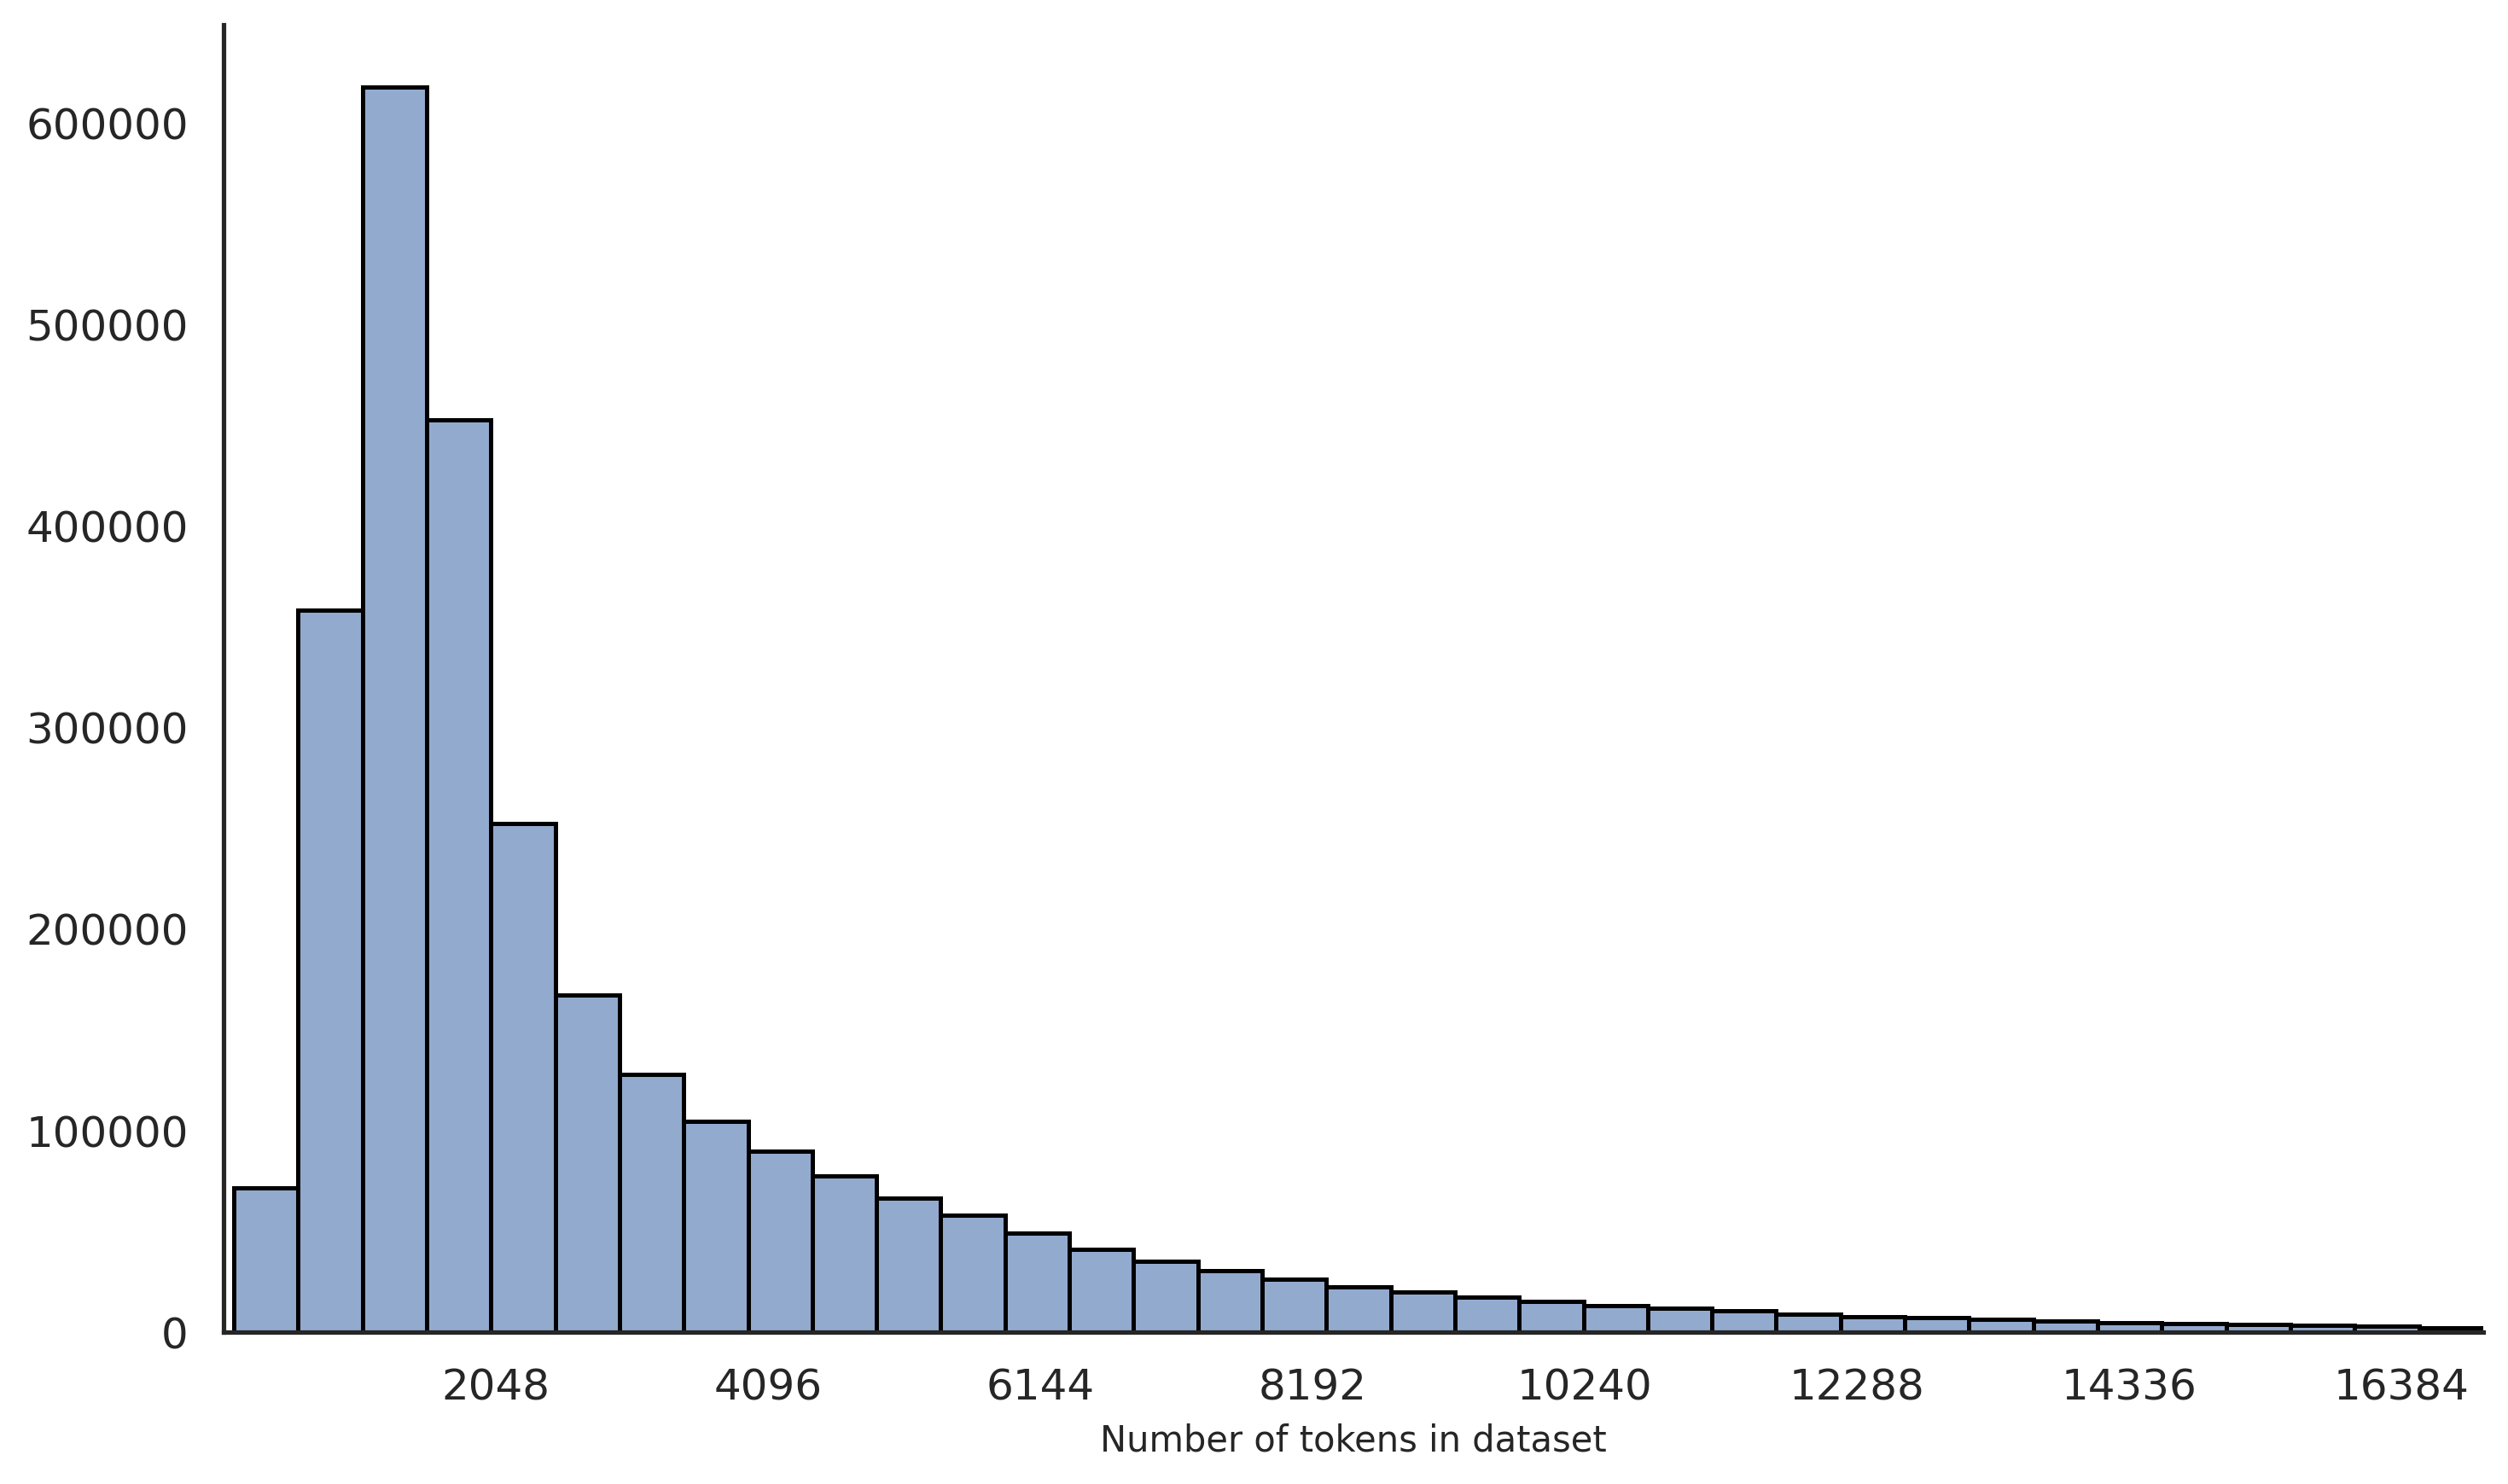
The image displays a histogram illustrating the frequency distribution of token counts within a dataset. The chart shows a strongly right-skewed distribution, where the vast majority of data samples contain a relatively low number of tokens, with a long tail extending towards higher token counts.
### Components/Axes
* **Chart Type:** Histogram (vertical bar chart).
* **X-Axis (Horizontal):**
* **Label:** "Number of tokens in dataset"
* **Scale:** Linear scale with major tick marks at intervals of 2048 (2048, 4096, 6144, 8192, 10240, 12288, 14336, 16384). The axis starts at 0.
* **Y-Axis (Vertical):**
* **Label:** Not explicitly labeled, but represents the frequency or count of samples.
* **Scale:** Linear scale with major tick marks at intervals of 100,000, ranging from 0 to 600,000.
* **Data Series:** A single data series represented by light blue bars with black outlines.
* **Legend:** No legend is present, as there is only one data series.
* **Title:** No chart title is visible within the image frame.
### Detailed Analysis
The histogram consists of approximately 30-35 contiguous bars (bins), each representing a range of token counts. The width of each bin appears consistent.
**Trend Verification:** The visual trend is a sharp peak at the lower end of the x-axis, followed by a steady, exponential-like decay as the number of tokens increases. The height of the bars decreases monotonically after the peak.
**Approximate Data Points (Key Bins):**
* **Bin 1 (Leftmost, ~0-512 tokens):** ~75,000 samples.
* **Bin 2 (~512-1024 tokens):** ~360,000 samples.
* **Bin 3 (~1024-1536 tokens):** **Peak of the distribution.** Approximately 620,000 samples. This is the mode of the dataset.
* **Bin 4 (~1536-2048 tokens):** ~450,000 samples.
* **Bin 5 (~2048-2560 tokens):** ~250,000 samples.
* **Bin 6 (~2560-3072 tokens):** ~170,000 samples.
* **Bin 7 (~3072-3584 tokens):** ~130,000 samples.
* **Bin 8 (~3584-4096 tokens):** ~105,000 samples.
* **At 4096 tokens:** The bar height is approximately 90,000.
* **At 6144 tokens:** The bar height is approximately 50,000.
* **At 8192 tokens:** The bar height is approximately 25,000.
* **At 10240 tokens:** The bar height is approximately 15,000.
* **At 12288 tokens:** The bar height is approximately 8,000.
* **At 16384 tokens (rightmost visible):** The bar height is very low, approximately 1,000-2,000 samples.
The distribution has a very long tail, with a non-zero number of samples containing up to at least 16,384 tokens.
### Key Observations
1. **Strong Right Skew:** The distribution is not symmetric. The mass of the data is concentrated on the left (shorter sequences).
2. **Clear Mode:** The most common token count range is between approximately 1024 and 1536 tokens.
3. **Rapid Initial Drop-off:** After the peak, the frequency drops by nearly half within the next two bins (by ~2560 tokens).
4. **Long Tail:** While the frequency is low, there is a significant number of samples with very high token counts (8000+), indicating the presence of long documents or concatenated texts in the dataset.
5. **No Gaps:** The histogram bars are contiguous, suggesting the data is continuous or has been binned without gaps.
### Interpretation
This histogram characterizes the composition of a text dataset used for training or evaluating a language model. The data suggests:
* **Dataset Composition:** The dataset is dominated by short to medium-length text samples (under 4096 tokens). This is typical for many web-scraped or curated text corpora.
* **Model Context Implications:** A model with a context window of 2048 or 4096 tokens would be able to process the majority of samples in their entirety. However, a substantial minority of samples (the long tail) would require truncation or would not fit, potentially leading to information loss for those specific examples.
* **Potential Data Curation:** The sharp peak and smooth decay might indicate intentional filtering or a natural property of the source data (e.g., social media posts, short articles). The absence of a secondary peak at very high token counts suggests the dataset is not heavily composed of concatenated documents or books.
* **Outliers:** The samples beyond 12,288 tokens are outliers in terms of length. Their presence, while numerically small, could be important for tasks requiring very long-range context understanding.
In summary, this visual provides a crucial profile of a dataset's sequence length distribution, which is fundamental for understanding model training dynamics, selecting appropriate context window sizes, and anticipating data preprocessing needs like truncation or packing.