## Chart: Classification Accuracies
### Overview
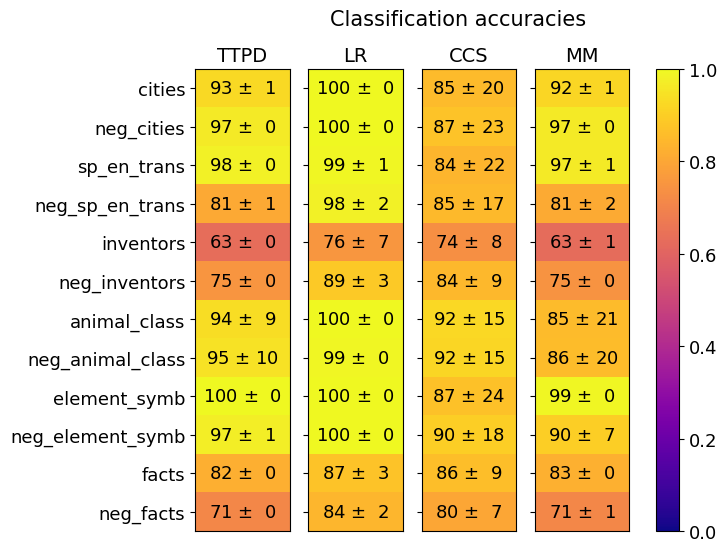
The image is a heatmap displaying classification accuracies for four different methods (TTPD, LR, CCS, MM) across various categories. The color intensity represents the accuracy score, ranging from dark blue (low accuracy) to bright yellow (high accuracy). Each cell contains the accuracy value and its associated uncertainty.
### Components/Axes
* **Title:** Classification accuracies
* **Columns (Methods):** TTPD, LR, CCS, MM
* **Rows (Categories):** cities, neg\_cities, sp\_en\_trans, neg\_sp\_en\_trans, inventors, neg\_inventors, animal\_class, neg\_animal\_class, element\_symb, neg\_element\_symb, facts, neg\_facts
* **Colorbar:** Ranges from 0.0 (dark blue) to 1.0 (bright yellow), representing the classification accuracy score.
### Detailed Analysis
Here's a breakdown of the accuracy values for each method and category:
* **cities:**
* TTPD: 93 ± 1
* LR: 100 ± 0
* CCS: 85 ± 20
* MM: 92 ± 1
* **neg\_cities:**
* TTPD: 97 ± 0
* LR: 100 ± 0
* CCS: 87 ± 23
* MM: 97 ± 0
* **sp\_en\_trans:**
* TTPD: 98 ± 0
* LR: 99 ± 1
* CCS: 84 ± 22
* MM: 97 ± 1
* **neg\_sp\_en\_trans:**
* TTPD: 81 ± 1
* LR: 98 ± 2
* CCS: 85 ± 17
* MM: 81 ± 2
* **inventors:**
* TTPD: 63 ± 0
* LR: 76 ± 7
* CCS: 74 ± 8
* MM: 63 ± 1
* **neg\_inventors:**
* TTPD: 75 ± 0
* LR: 89 ± 3
* CCS: 84 ± 9
* MM: 75 ± 0
* **animal\_class:**
* TTPD: 94 ± 9
* LR: 100 ± 0
* CCS: 92 ± 15
* MM: 85 ± 21
* **neg\_animal\_class:**
* TTPD: 95 ± 10
* LR: 99 ± 0
* CCS: 92 ± 15
* MM: 86 ± 20
* **element\_symb:**
* TTPD: 100 ± 0
* LR: 100 ± 0
* CCS: 87 ± 24
* MM: 99 ± 0
* **neg\_element\_symb:**
* TTPD: 97 ± 1
* LR: 100 ± 0
* CCS: 90 ± 18
* MM: 90 ± 7
* **facts:**
* TTPD: 82 ± 0
* LR: 87 ± 3
* CCS: 86 ± 9
* MM: 83 ± 0
* **neg\_facts:**
* TTPD: 71 ± 0
* LR: 84 ± 2
* CCS: 80 ± 7
* MM: 71 ± 1
### Key Observations
* LR consistently shows high accuracy, often reaching 100%, across many categories.
* TTPD and MM have similar performance, with some categories showing lower accuracy (e.g., "inventors," "neg\_facts").
* CCS generally has lower accuracy and higher uncertainty (larger standard deviation) compared to the other methods.
* The "inventors" category has the lowest accuracy across all methods.
### Interpretation
The heatmap visualizes the performance of four classification methods on different categories. LR appears to be the most accurate method overall. CCS exhibits the least consistent performance, indicated by the larger uncertainty values. The "inventors" category seems to be the most challenging for all methods, suggesting that it may require a different approach or more data for accurate classification. The "neg\_" prefixed categories represent negative examples, and their performance relative to the positive examples provides insights into the classifier's ability to distinguish between the two.