## Heatmap: Classification Accuracies
### Overview
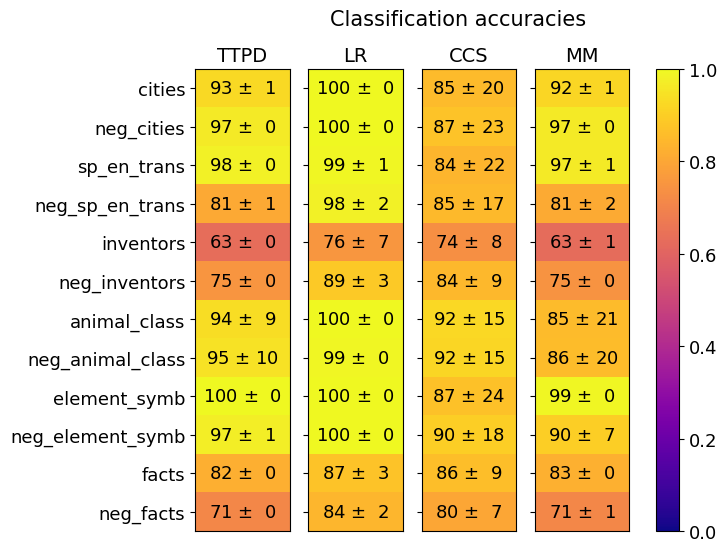
The image is a heatmap visualizing classification accuracy across four methods (TTPD, LR, CCS, MM) for 12 categories. Accuracy values are represented by color intensity (yellow = highest, purple = lowest) and numerical values with standard deviations (e.g., "93 ± 1"). The heatmap emphasizes performance disparities between methods and categories.
### Components/Axes
- **X-axis (Methods)**: TTPD, LR, CCS, MM (left to right).
- **Y-axis (Categories)**:
1. cities
2. neg_cities
3. sp_en_trans
4. neg_sp_en_trans
5. inventors
6. neg_inventors
7. animal_class
8. neg_animal_class
9. element_symbol
10. neg_element_symbol
11. facts
12. neg_facts
- **Legend**: Color gradient from 0.0 (purple) to 1.0 (yellow), indicating accuracy. Positioned on the right.
### Detailed Analysis
#### TTPD
- **cities**: 93 ± 1 (yellow-orange)
- **neg_cities**: 97 ± 0 (yellow)
- **sp_en_trans**: 98 ± 0 (yellow)
- **neg_sp_en_trans**: 81 ± 1 (orange)
- **inventors**: 63 ± 0 (red)
- **neg_inventors**: 75 ± 0 (orange)
- **animal_class**: 94 ± 9 (yellow)
- **neg_animal_class**: 95 ± 10 (yellow)
- **element_symbol**: 100 ± 0 (bright yellow)
- **neg_element_symbol**: 97 ± 1 (yellow)
- **facts**: 82 ± 0 (orange)
- **neg_facts**: 71 ± 0 (red)
#### LR
- **cities**: 100 ± 0 (bright yellow)
- **neg_cities**: 100 ± 0 (bright yellow)
- **sp_en_trans**: 99 ± 1 (yellow)
- **neg_sp_en_trans**: 98 ± 2 (yellow)
- **inventors**: 76 ± 7 (orange)
- **neg_inventors**: 89 ± 3 (orange)
- **animal_class**: 100 ± 0 (bright yellow)
- **neg_animal_class**: 99 ± 0 (yellow)
- **element_symbol**: 100 ± 0 (bright yellow)
- **neg_element_symbol**: 100 ± 0 (bright yellow)
- **facts**: 87 ± 3 (orange)
- **neg_facts**: 84 ± 2 (orange)
#### CCS
- **cities**: 85 ± 20 (orange)
- **neg_cities**: 87 ± 23 (orange)
- **sp_en_trans**: 84 ± 22 (orange)
- **neg_sp_en_trans**: 85 ± 17 (orange)
- **inventors**: 74 ± 8 (orange)
- **neg_inventors**: 84 ± 9 (orange)
- **animal_class**: 92 ± 15 (yellow)
- **neg_animal_class**: 92 ± 15 (yellow)
- **element_symbol**: 87 ± 24 (orange)
- **neg_element_symbol**: 90 ± 18 (orange)
- **facts**: 86 ± 9 (orange)
- **neg_facts**: 80 ± 7 (orange)
#### MM
- **cities**: 92 ± 1 (yellow)
- **neg_cities**: 97 ± 0 (yellow)
- **sp_en_trans**: 97 ± 1 (yellow)
- **neg_sp_en_trans**: 81 ± 2 (orange)
- **inventors**: 63 ± 1 (red)
- **neg_inventors**: 75 ± 0 (orange)
- **animal_class**: 85 ± 21 (orange)
- **neg_animal_class**: 86 ± 20 (orange)
- **element_symbol**: 99 ± 0 (yellow)
- **neg_element_symbol**: 90 ± 7 (orange)
- **facts**: 83 ± 0 (orange)
- **neg_facts**: 71 ± 1 (red)
### Key Observations
1. **High-Performing Methods**:
- LR achieves 100% accuracy in "cities," "neg_cities," "animal_class," and "element_symbol."
- TTPD and MM show near-perfect accuracy (97–100%) in most categories except "inventors" and "neg_inventors."
2. **Low-Performing Categories**:
- "inventors" and "neg_inventors" consistently underperform across all methods (63–89%).
- "neg_facts" has the lowest accuracy (71 ± 1 for TTPD/MM, 80 ± 7 for CCS).
3. **Variance Patterns**:
- CCS exhibits the highest variance (e.g., ±20 for "cities"), suggesting instability.
- LR and TTPD show minimal variance (0–10) in most cases.
### Interpretation
- **Method Strengths**: LR dominates in categories with binary or unambiguous labels (e.g., "element_symbol"), while TTPD and MM excel in general cases. CCS struggles with consistency, particularly in "neg_animal_class" (±15 variance).
- **Category Challenges**: "Inventors" and "neg_inventors" likely involve complex or ambiguous patterns, reducing accuracy. "neg_facts" may suffer from insufficient training data or noisy labels.
- **Color-Legend Alignment**: All values align with the legend (e.g., 93 ± 1 in TTPD matches yellow-orange). No discrepancies detected.
This heatmap highlights trade-offs between accuracy and robustness, with LR and TTPD offering reliability but CCS introducing variability. The underperformance in inventor-related categories suggests domain-specific challenges requiring further investigation.